Fig. B.1.
Download original image
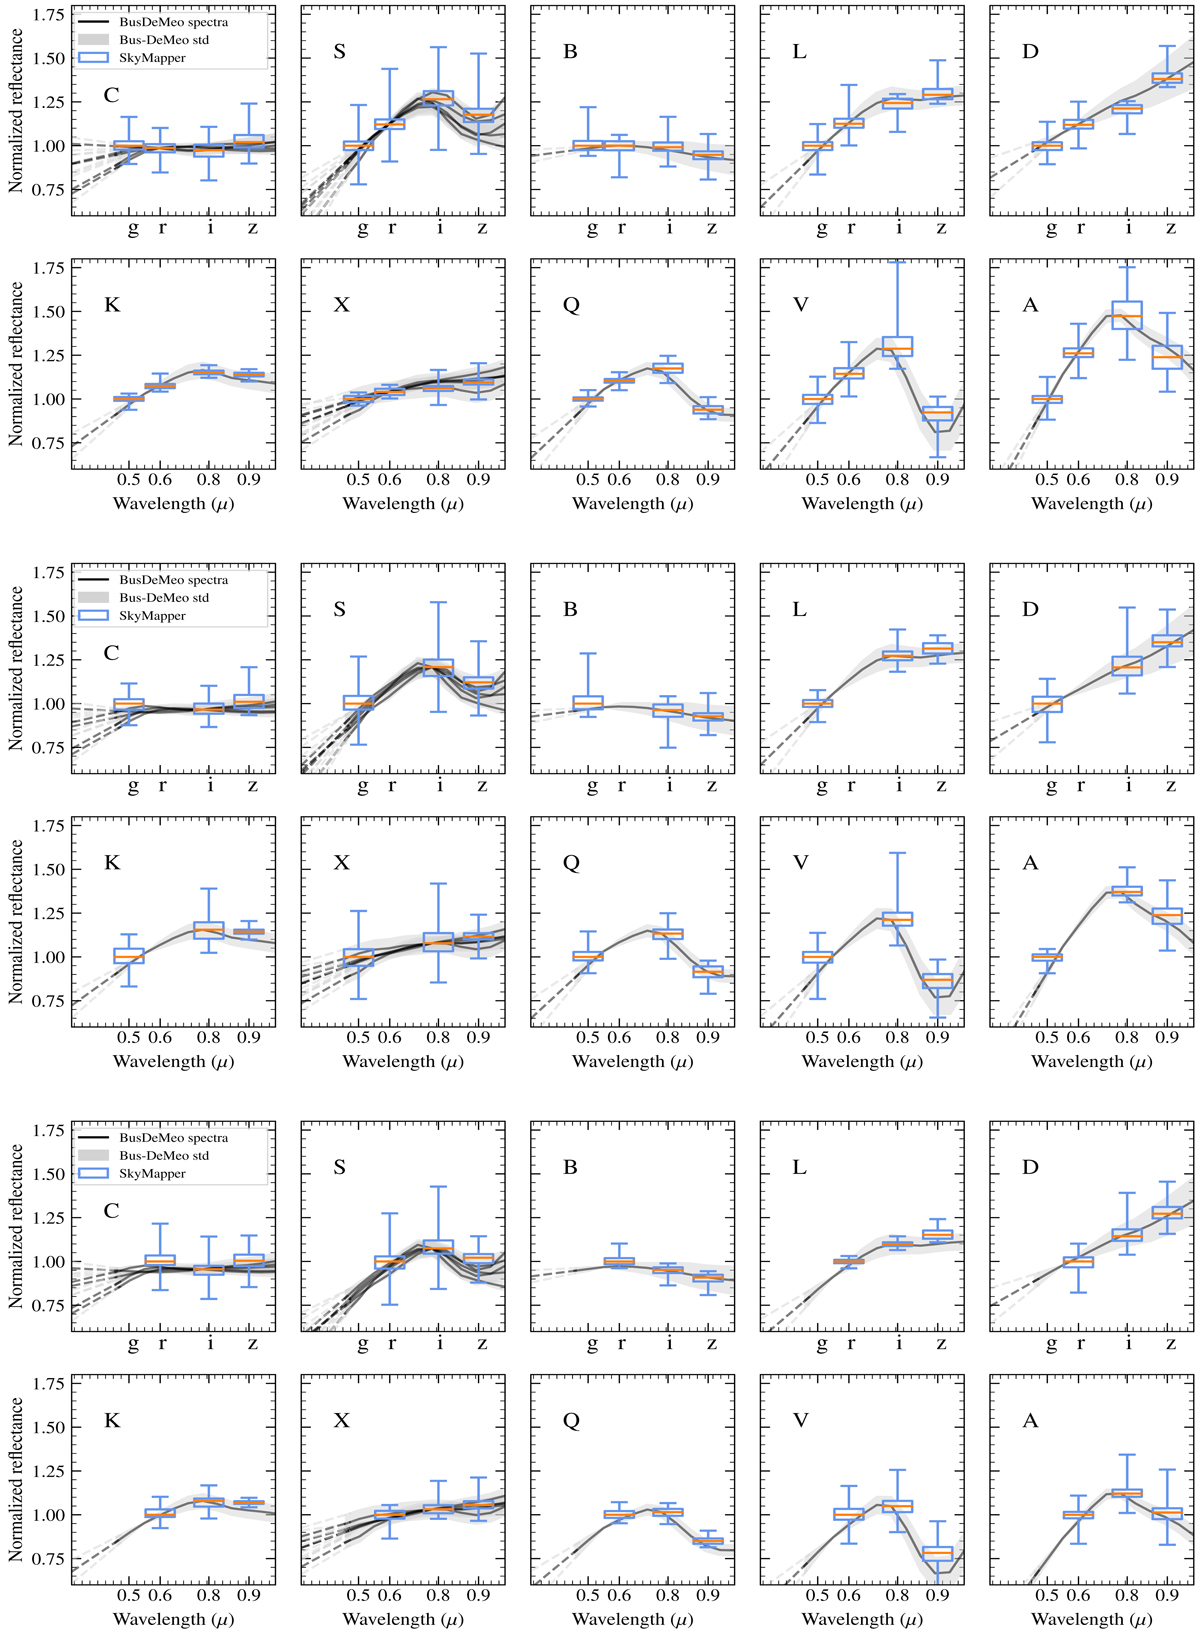
Grouped by taxonomic class pseudo-reflectance spectra of asteroids based on two-color taxonomy. Top: g − r, i − z colors, middle: g − i, i − z colors, and bottom: r − i, i − z colors. We indicate the average wavelength of each filter in the lower plots. The distribution of values for each band is represented by whiskers (95% extrema, and the 25, 50, and 75% quartiles). For each, we also represent the associated template spectra of the Bus-DeMeo taxonomy (DeMeo et al. 2009).
Current usage metrics show cumulative count of Article Views (full-text article views including HTML views, PDF and ePub downloads, according to the available data) and Abstracts Views on Vision4Press platform.
Data correspond to usage on the plateform after 2015. The current usage metrics is available 48-96 hours after online publication and is updated daily on week days.
Initial download of the metrics may take a while.