Fig. 7
Download original image
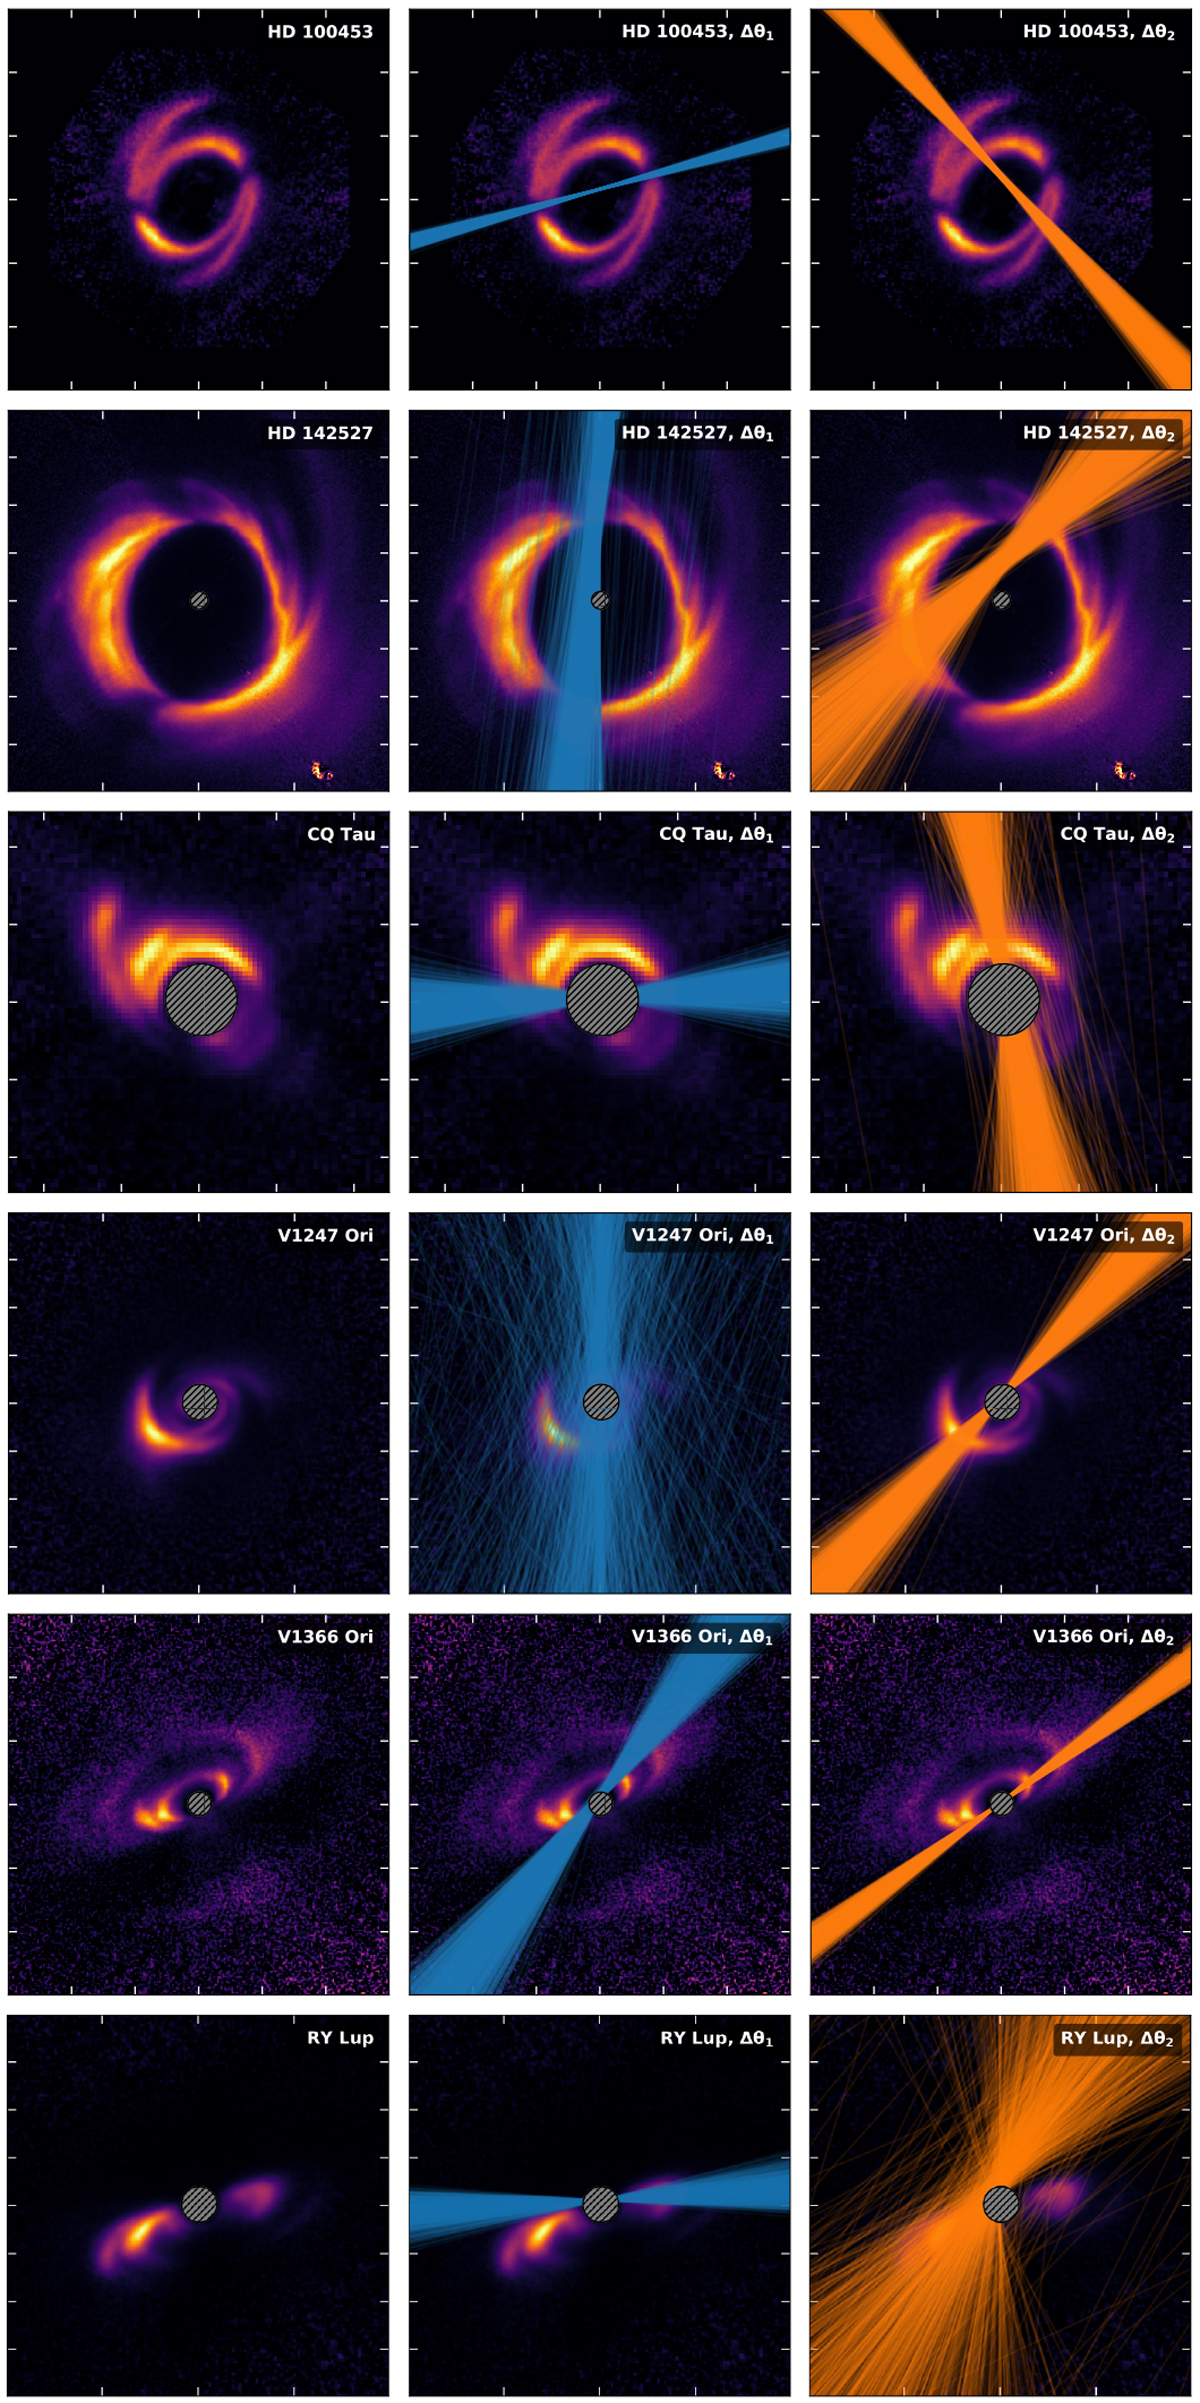
Left: scattered light images. Middle, right: same, with predicted lines connecting putative shadows based on both potential misalignment configurations, Δθ1 and Δθ2, respectively. The colored lines are 1000 randomly drawn samples from our posterior distributions that describe the shadow locations. The gray circles indicate the coronagraph.
Current usage metrics show cumulative count of Article Views (full-text article views including HTML views, PDF and ePub downloads, according to the available data) and Abstracts Views on Vision4Press platform.
Data correspond to usage on the plateform after 2015. The current usage metrics is available 48-96 hours after online publication and is updated daily on week days.
Initial download of the metrics may take a while.