Fig. 5
Download original image
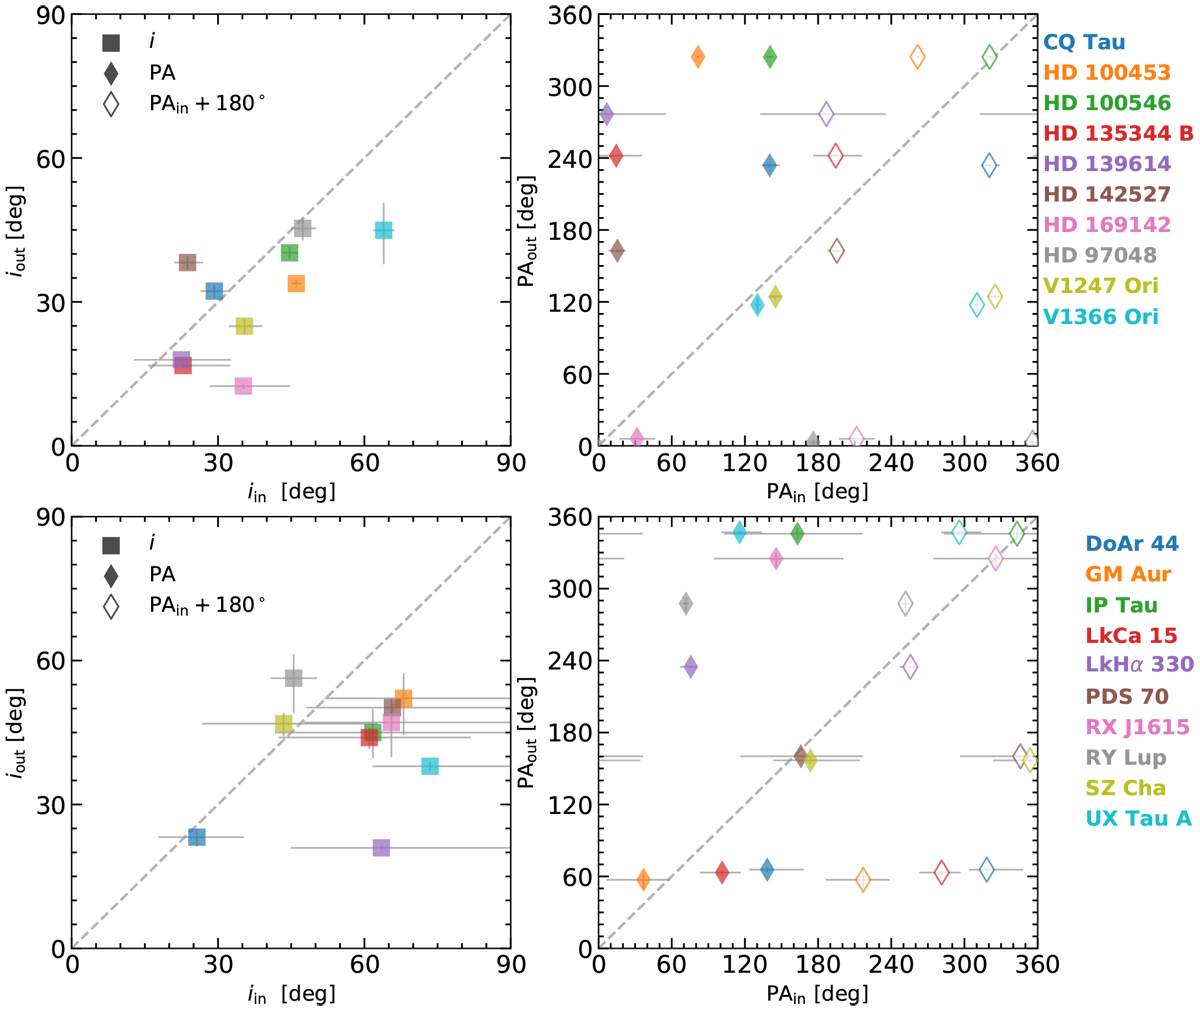
Misalignments between inner and outer disks in our sample of transition disks. The upper and bottom panels show the misalignments for the most massive stars of our sample (Herbig Ae/Be and intermediate-mass T Tauri stars) and for the T Tauri stars, respectively. Left panels: comparison of outer and inner disk inclinations. The dashed line indicates perfect alignment in inclination. Right panels: same as left panel but for inner and outer disk position angles. As we do not know the true orientation of the inner disk, we present both possibilities for the inner disk near sides. The full-colored markers represent the position angles from the GRAVITY fits and the white markers with the colored edges have an additional offset of 180°.
Current usage metrics show cumulative count of Article Views (full-text article views including HTML views, PDF and ePub downloads, according to the available data) and Abstracts Views on Vision4Press platform.
Data correspond to usage on the plateform after 2015. The current usage metrics is available 48-96 hours after online publication and is updated daily on week days.
Initial download of the metrics may take a while.