Fig. 4
Download original image
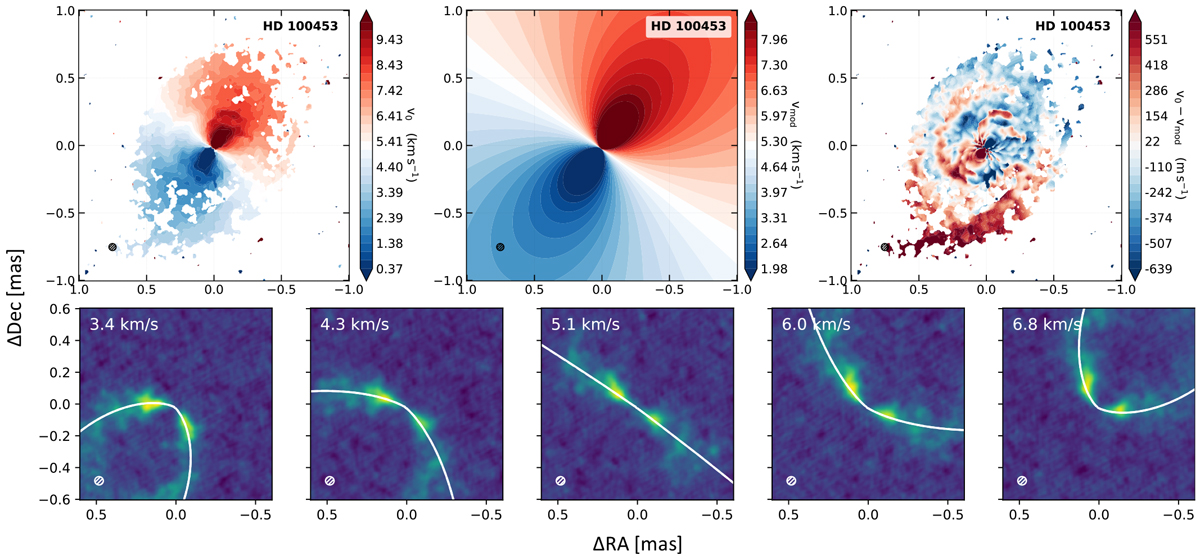
Velocity maps and model fits to the ALMA CO line data of HD 100453. In all images north points up and east to the left. Top left: quadratically collapsed moment map derived with bettermoments. Top center: best-fit Keplerian disk model derived with the eddy tool. Top right: residuals after subtraction of the model from the data. Bottom panels: iso-velocity contours of the best-fit model plotted for the individual channel maps of the data cube.
Current usage metrics show cumulative count of Article Views (full-text article views including HTML views, PDF and ePub downloads, according to the available data) and Abstracts Views on Vision4Press platform.
Data correspond to usage on the plateform after 2015. The current usage metrics is available 48-96 hours after online publication and is updated daily on week days.
Initial download of the metrics may take a while.