Fig. 2
Download original image
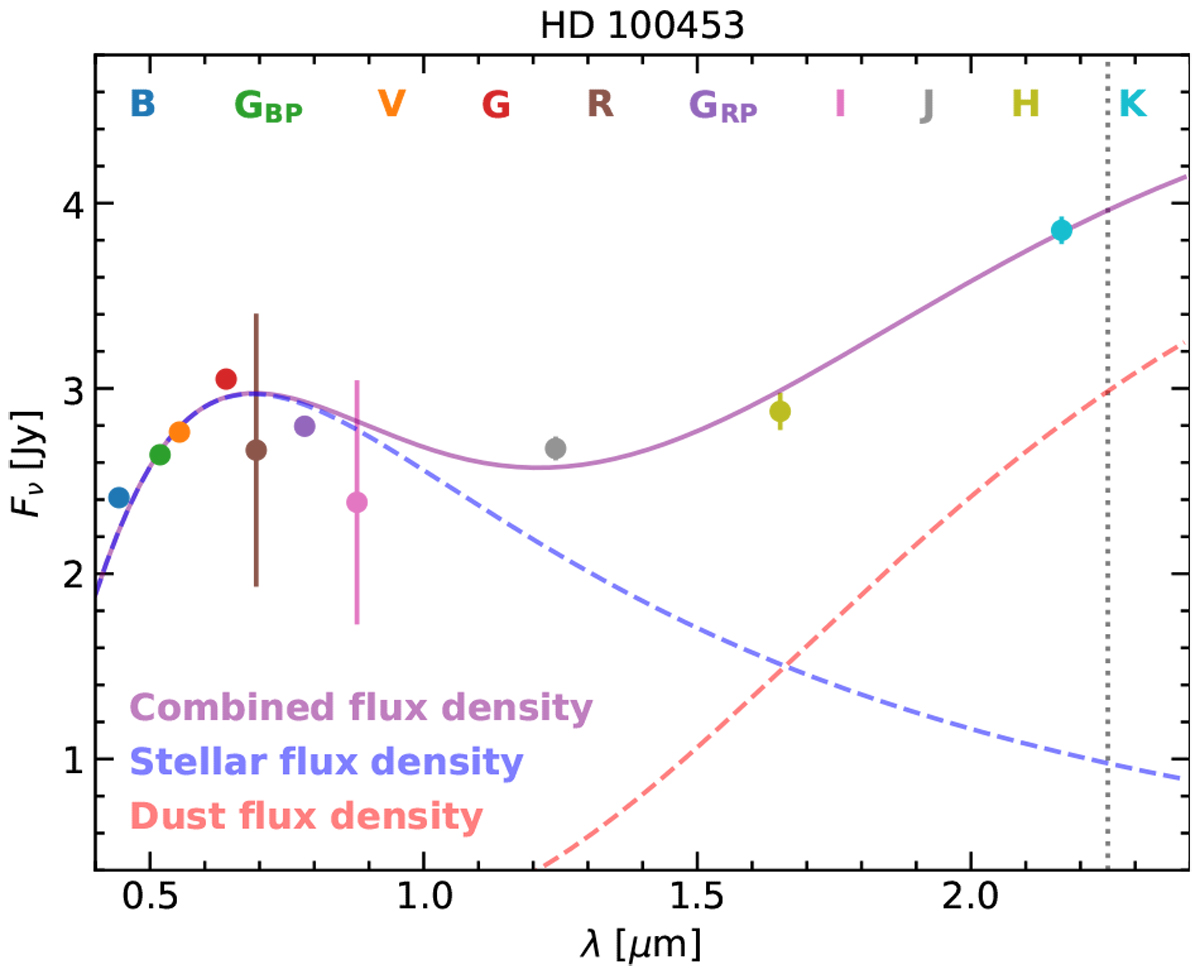
SED fit for HD 100453. The circles represent the photometry and the solid purple curve, the best SED model from the MCMC posterior distribution. The model consists of two individual blackbody components that are visualized by the dashed lines: the blue curve represents the stellar flux density whereas the red curve shows the flux density of the circumstellar dust. The dotted line indicates the GRAVITY reference wavelength of 2.25 μm, at which we evaluate the dust flux contribution.
Current usage metrics show cumulative count of Article Views (full-text article views including HTML views, PDF and ePub downloads, according to the available data) and Abstracts Views on Vision4Press platform.
Data correspond to usage on the plateform after 2015. The current usage metrics is available 48-96 hours after online publication and is updated daily on week days.
Initial download of the metrics may take a while.