Open Access
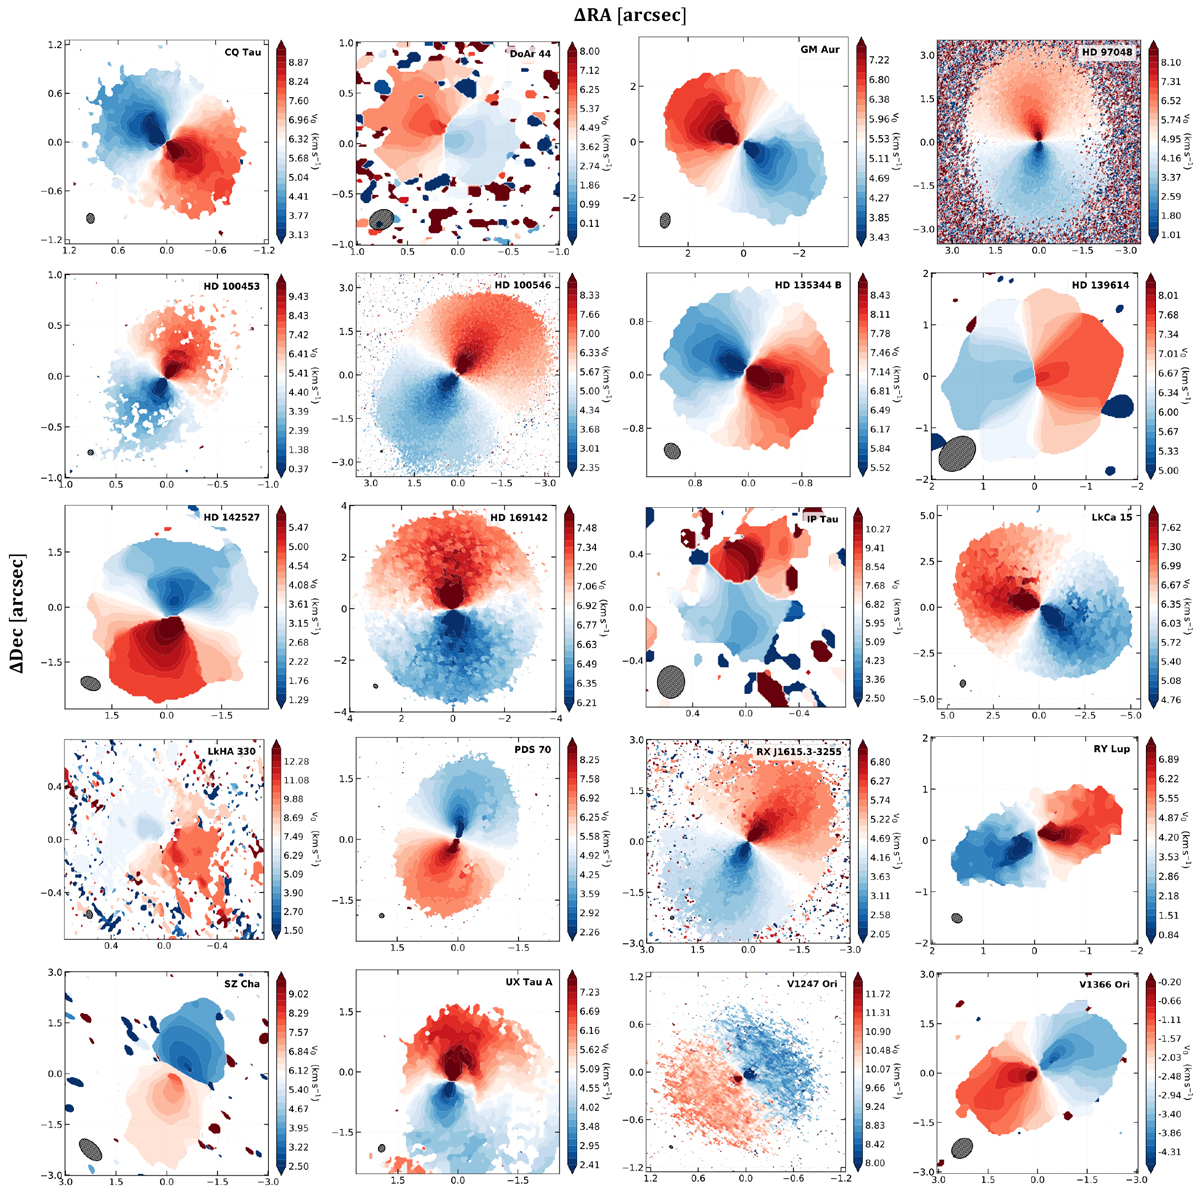
Fig. C.1
Download original image
ALMA line data of our targets. We present the quadratically collapsed moment maps that were created with bettermoments by quadratic collapsing of the frequency channels. The ellipse in the lower left of each panel indicates the beam size of the observation. For all images north points up and east to the left.
Current usage metrics show cumulative count of Article Views (full-text article views including HTML views, PDF and ePub downloads, according to the available data) and Abstracts Views on Vision4Press platform.
Data correspond to usage on the plateform after 2015. The current usage metrics is available 48-96 hours after online publication and is updated daily on week days.
Initial download of the metrics may take a while.