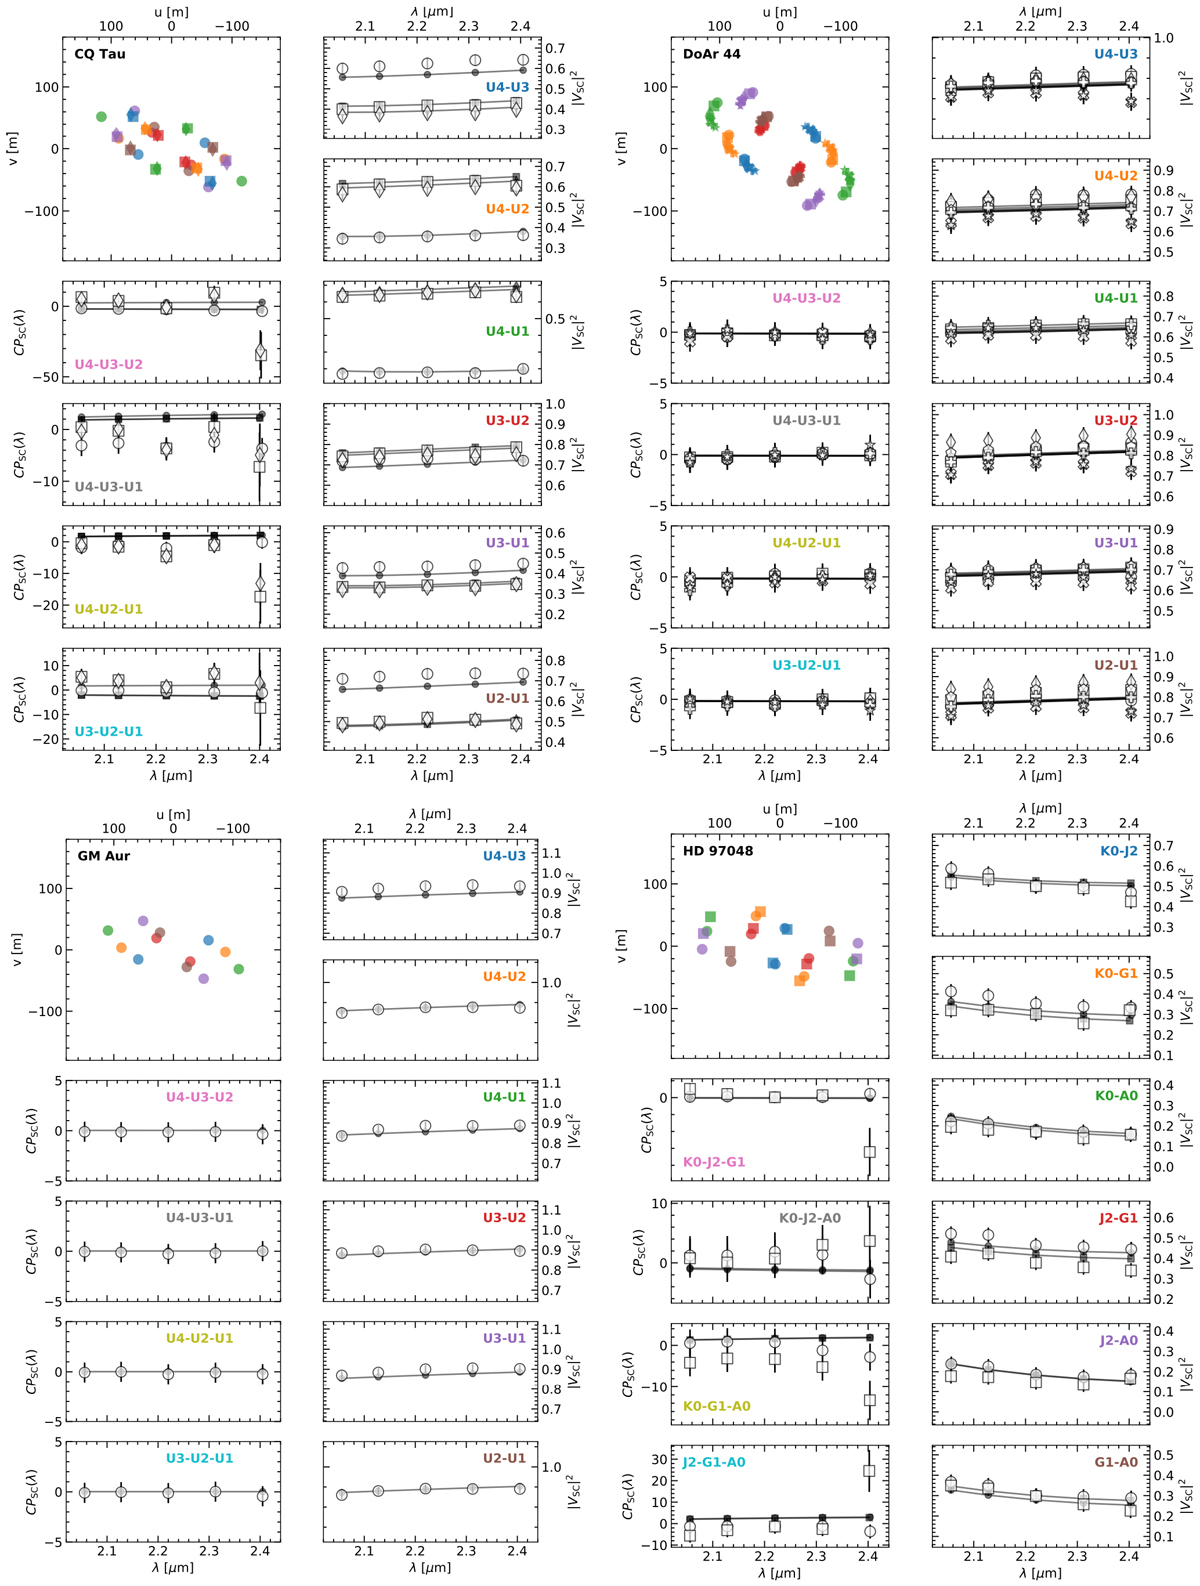
Fig. B.2
Download original image
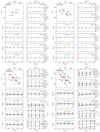
GRAVITY observables and model fits. In the upper left of each panel, the (u, v) plane coverage is shown. Each symbol corresponds to an individual exposures and the colors refer to the interferometric baselines. The other panels of the plot show the squared visibilities (right) and closure phases (left) for each baseline or triplet as a function of wavelength. The white markers with black contours represent the observational data and the black lines correspond to our best-fit model. The black markers on top of the lines indicate which curve corresponds to which exposure.
Current usage metrics show cumulative count of Article Views (full-text article views including HTML views, PDF and ePub downloads, according to the available data) and Abstracts Views on Vision4Press platform.
Data correspond to usage on the plateform after 2015. The current usage metrics is available 48-96 hours after online publication and is updated daily on week days.
Initial download of the metrics may take a while.