Fig. 1
Download original image
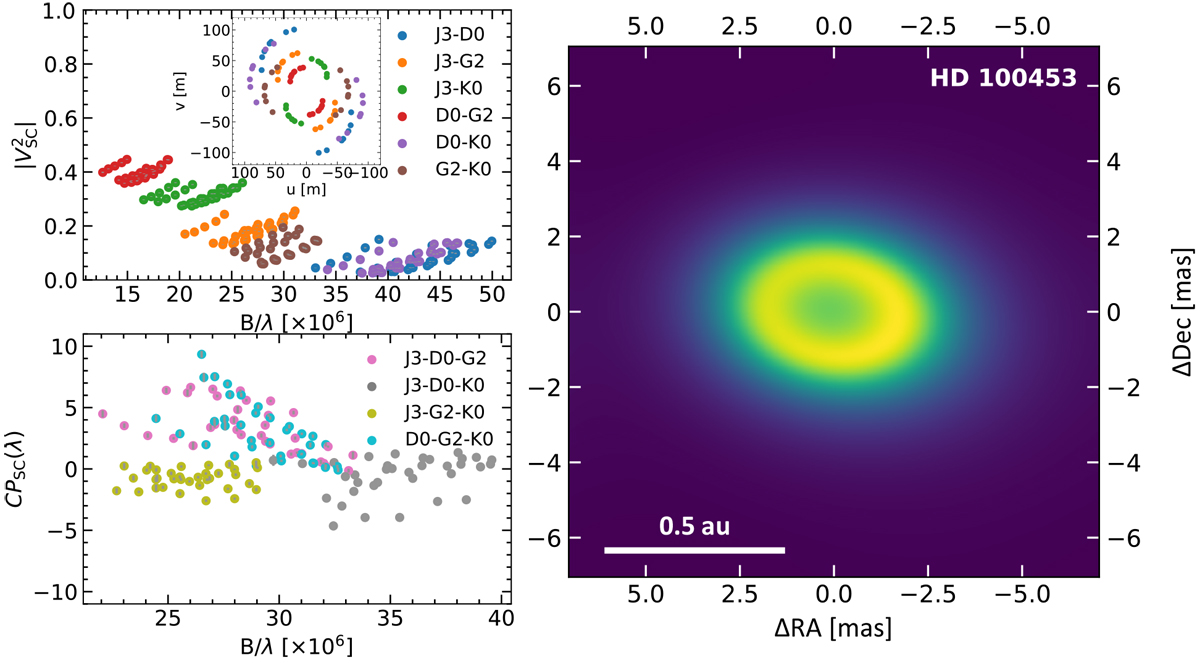
GRAVITY observations and best-fit model for HD 100453. Top left: squared visibilities as a function of spatial frequency. Colors refer to the different baselines. The inset presents the (u, v) plane coverage of the observations. Bottom left: closure phases as a function of the average spatial frequency. The various colors refer to the different triplets. Right panel: best-fit model.
Current usage metrics show cumulative count of Article Views (full-text article views including HTML views, PDF and ePub downloads, according to the available data) and Abstracts Views on Vision4Press platform.
Data correspond to usage on the plateform after 2015. The current usage metrics is available 48-96 hours after online publication and is updated daily on week days.
Initial download of the metrics may take a while.