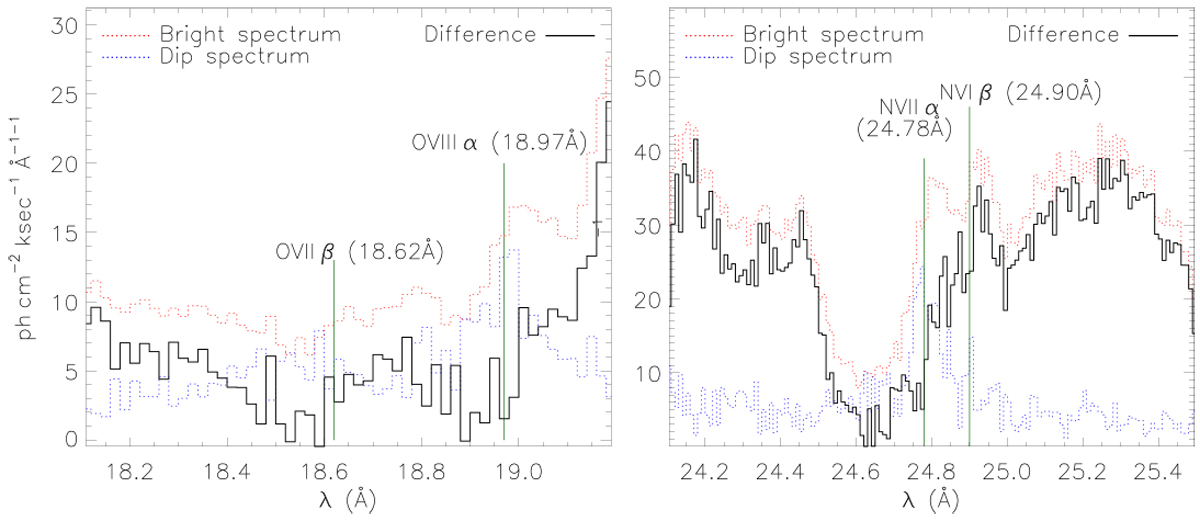
Fig. 7
Download original image
Dip spectrum, shown with dotted blue lines, most likely represents emission that is also present during the bright spectrum (red dotted lines). It probably does not originate from the SSS photosphere but further outside, likely the shock emission site. As an illustration of how the pure SSS spectrum may look, the difference between bright and dip spectrum is shown with black solid lines for oxygen (left) and the nitrogen lines (right; see labels). See Sect. 3.2.3 for discussion.
Current usage metrics show cumulative count of Article Views (full-text article views including HTML views, PDF and ePub downloads, according to the available data) and Abstracts Views on Vision4Press platform.
Data correspond to usage on the plateform after 2015. The current usage metrics is available 48-96 hours after online publication and is updated daily on week days.
Initial download of the metrics may take a while.