Fig. 6
Download original image
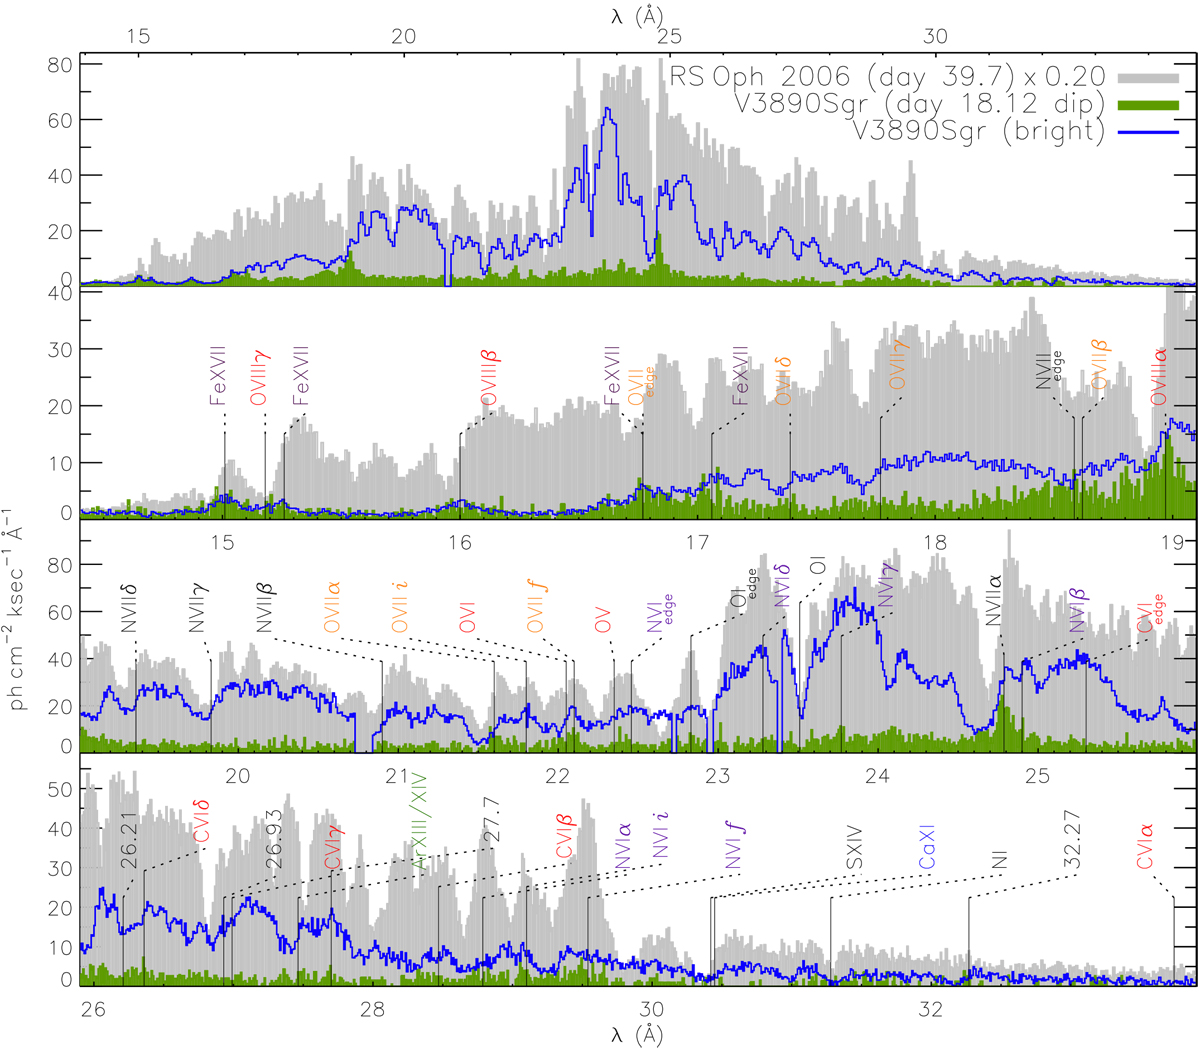
Comparison of RGS spectra of V3890 Sgr extracted during the dip (dark green shadings) and during time intervals excluding the dip and the initial rise (blue line). The top panel shows the full spectral range of interest, while the panels below zoom in to show more detail. The light grey shading is the Chandra LETGS spectrum of RS Oph taken on day 39.7 after outburst (Chandra ObsID 7296), scaled down by a factor of 5. See Sect. 3.2.3 for discussion. Labels with different colours for different ions are included at their rest wavelengths.
Current usage metrics show cumulative count of Article Views (full-text article views including HTML views, PDF and ePub downloads, according to the available data) and Abstracts Views on Vision4Press platform.
Data correspond to usage on the plateform after 2015. The current usage metrics is available 48-96 hours after online publication and is updated daily on week days.
Initial download of the metrics may take a while.