Free Access
Fig. 5
Download original image
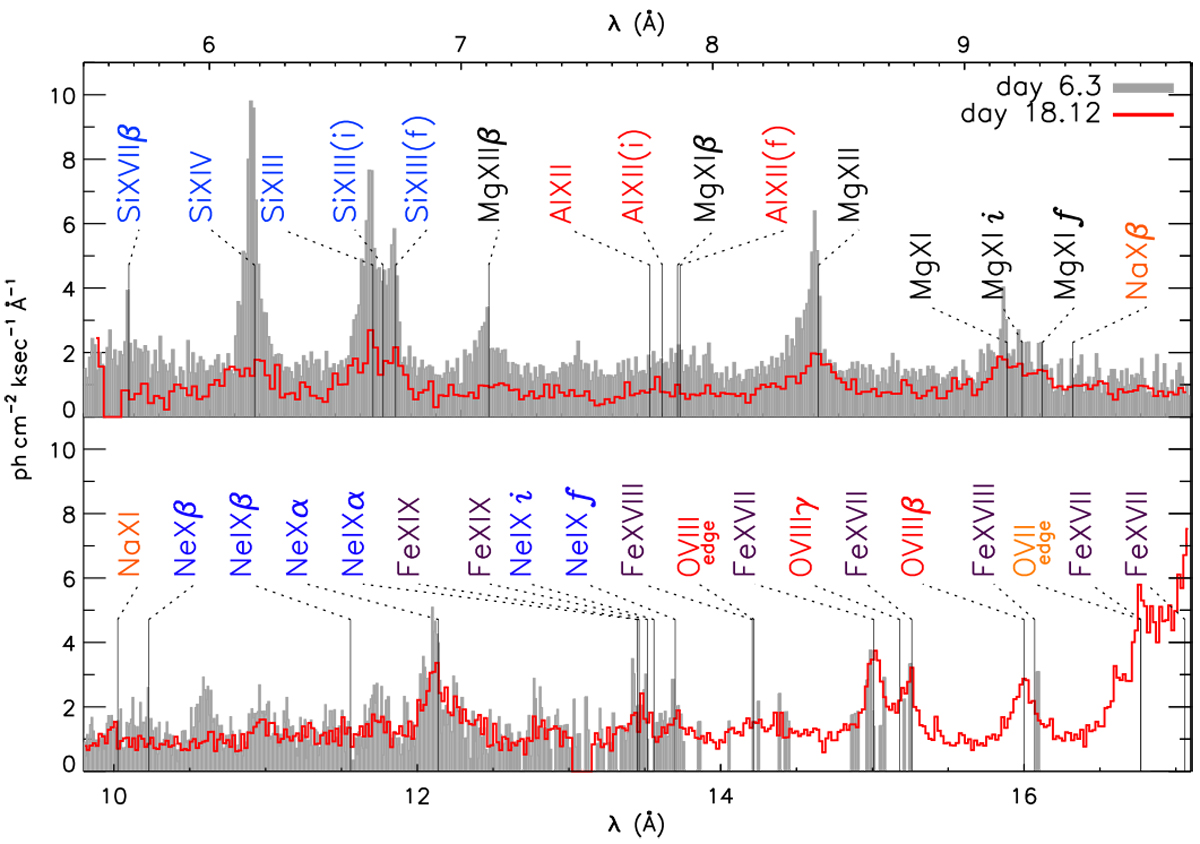
Comparison of the pre-SSS Chandra HETG spectrum taken on day 6.3 (ObsID 22 845; Orio et al. 2020) and the XMM-Newton RGS spectrum taken on day 18.12. The line labels are placed at rest wavelengths using different colours for different elements for better distinction. See Sect. 3.2.2 for discussion.
Current usage metrics show cumulative count of Article Views (full-text article views including HTML views, PDF and ePub downloads, according to the available data) and Abstracts Views on Vision4Press platform.
Data correspond to usage on the plateform after 2015. The current usage metrics is available 48-96 hours after online publication and is updated daily on week days.
Initial download of the metrics may take a while.