Fig. 4
Download original image
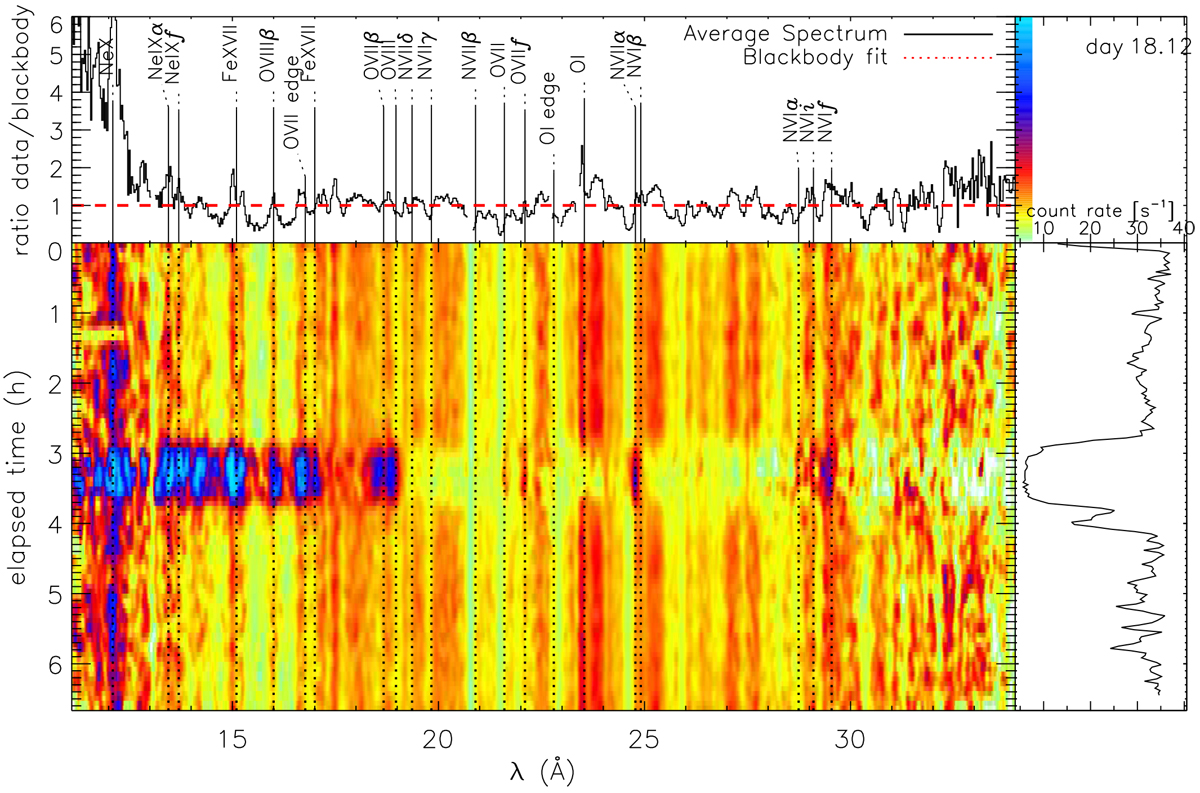
Same as Fig. 3, where each of the 48 spectra were divided by a blackbody curve with the same parameters as the dotted red line in the top panel of Fig. 3, only re-normalised to the brightness of the respective spectrum. Wavelengths at which the ratio is below one indicate absorption lines; e.g., N VII at 24.8 Å, whereas wavelengthswith ratios greater than 1 indicate emission lines, that is, the same N VII or the N VI forbidden line at 29.1 Å duringthe dip. See Sect. 3.2.1 for details.
Current usage metrics show cumulative count of Article Views (full-text article views including HTML views, PDF and ePub downloads, according to the available data) and Abstracts Views on Vision4Press platform.
Data correspond to usage on the plateform after 2015. The current usage metrics is available 48-96 hours after online publication and is updated daily on week days.
Initial download of the metrics may take a while.