Fig. 3
Download original image
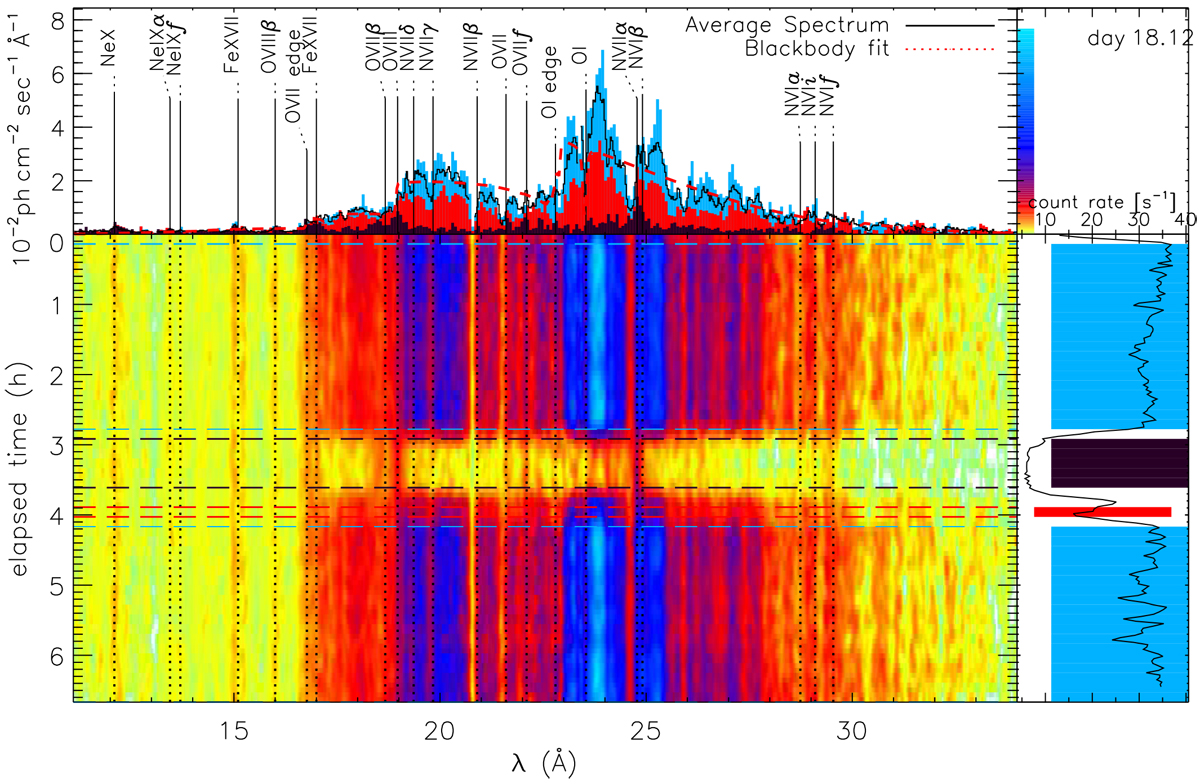
Spectral time map based on 48 RGS spectra extracted from adjacent 500 s time intervals. The main panel shows the spectra with wavelength across, time down, and flux colour-coded following the non-linear colours shown as bars in the top rightpanel along the vertical flux axis. The shadings in the bottom right panel indicate time intervals from which the spectra shown in the same colour shadings in the top left panel have been extracted. In the top left panel, the total spectrum is also shown with a solid black line, and a simple blackbody fit is represented by the dotted red line. See Sect. 3.2.1 for details.
Current usage metrics show cumulative count of Article Views (full-text article views including HTML views, PDF and ePub downloads, according to the available data) and Abstracts Views on Vision4Press platform.
Data correspond to usage on the plateform after 2015. The current usage metrics is available 48-96 hours after online publication and is updated daily on week days.
Initial download of the metrics may take a while.