Fig. 2
Download original image
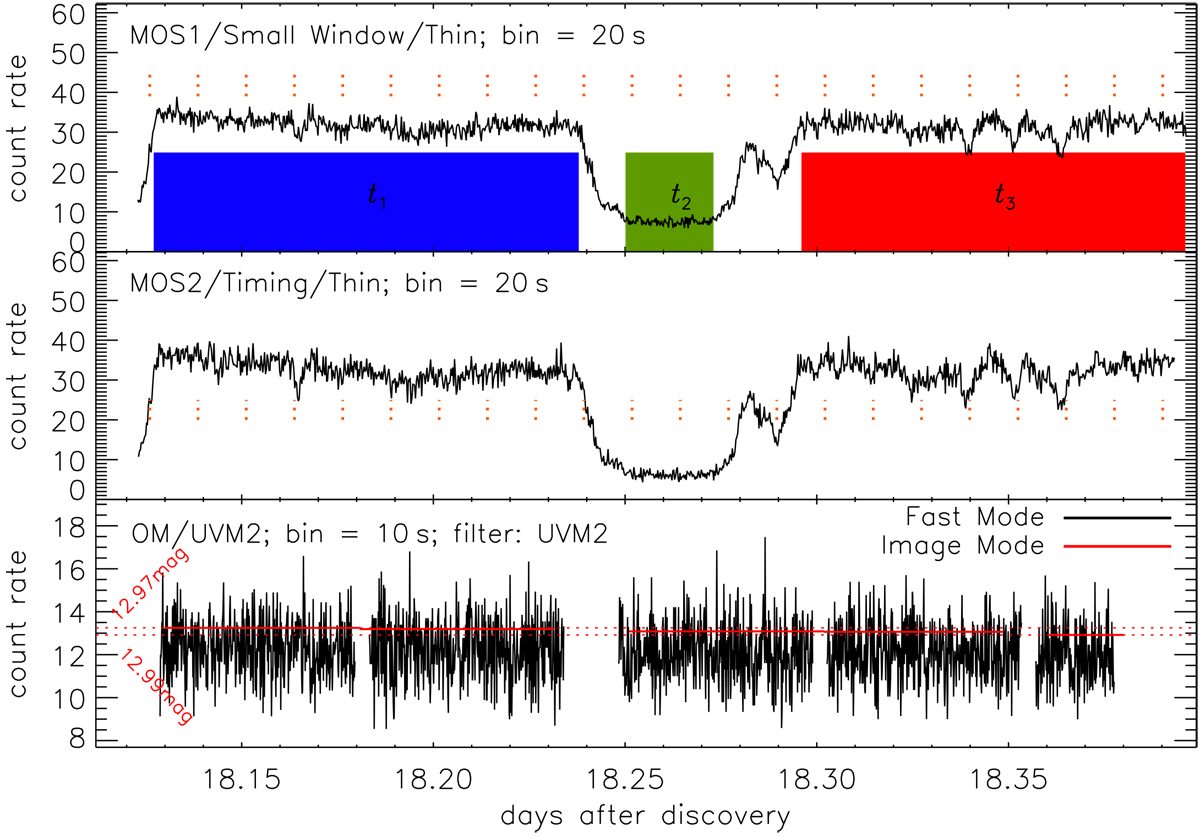
XMM-Newton X-ray and UV light curves (units counts per second) extracted from MOS1 (small window, 200–850 eV range), MOS2 (timing mode, 200–850 eV range), and the optical monitor (image+fast mode with the UVM2 filter: ~ 1620−2620Å range). In the top panel, shaded areas mark three light curve segments analysed separately in Sect. 4.2. 22 short orange dotted vertical lines are spaced by 18.1 min (centred in the secondary dip within egress from the deep dip), corresponding to the frequency of 0.92 mHz discussed in Sect. 4.2. Of these 22 marks, eight (36%) correspond to an anomaly in the light curve (deep dip in- egress or small dip), while the duty cycle increases to 50% (5/10) after the dip, leading to a formally statistical detection. In the bottom panel, the high time resolution OM fast mode light curve is shown in black. Three OM Image mode exposures were taken simultaneously with each OM fast mode segment, and the average image mode count rates are shown with the horizontal orange lines covering the start+stop times. The red horizontal lines mark the magnitude range 12.97–12.99 within which the sources gradually fade from start to the end of the observation. This magnitude range is ~ 5 mag brighter than during quiescence (see text). See Sect. 3.1 for discussion.
Current usage metrics show cumulative count of Article Views (full-text article views including HTML views, PDF and ePub downloads, according to the available data) and Abstracts Views on Vision4Press platform.
Data correspond to usage on the plateform after 2015. The current usage metrics is available 48-96 hours after online publication and is updated daily on week days.
Initial download of the metrics may take a while.