Fig. 17
Download original image
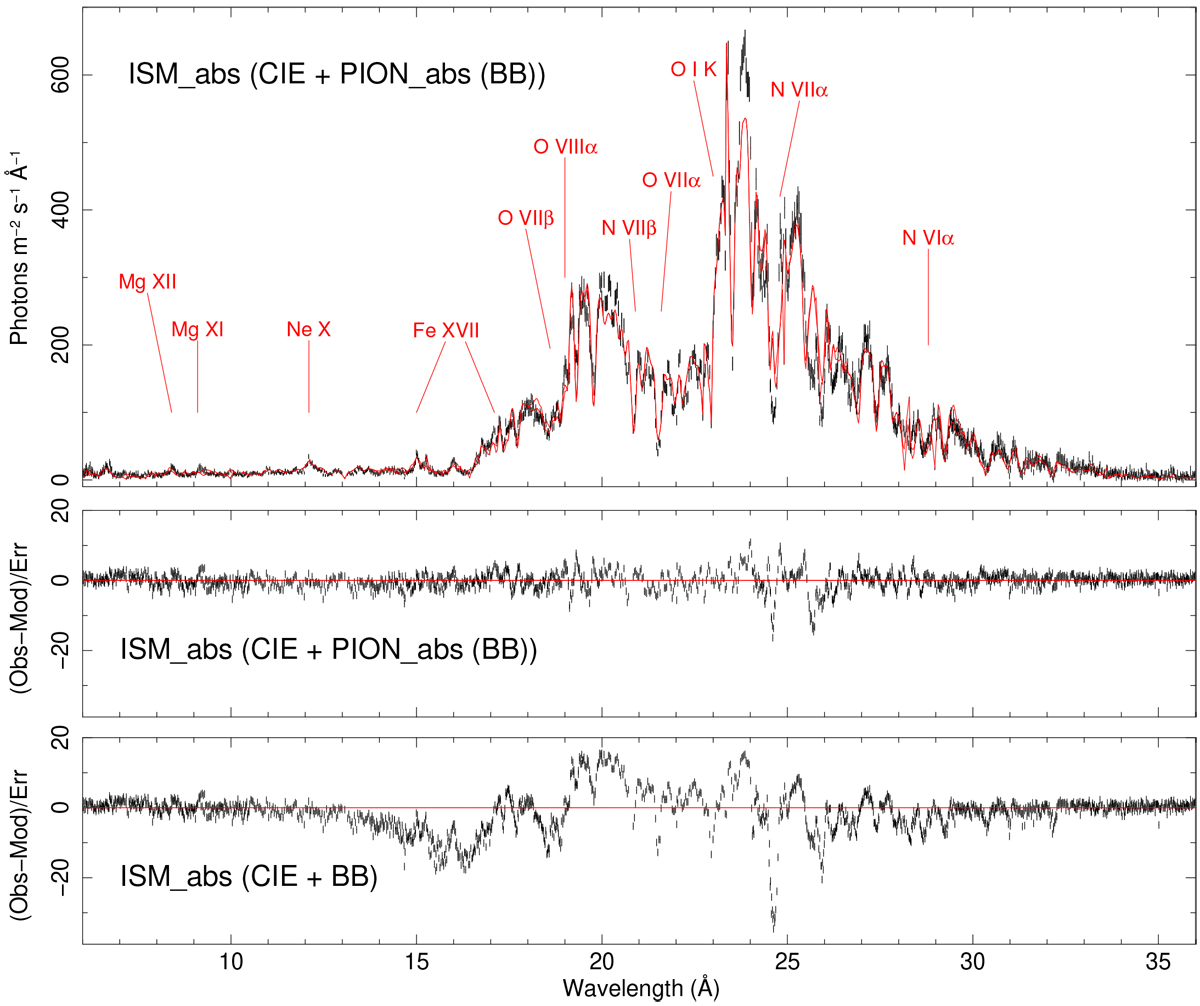
XMM-Newton RGS spectrum of V3890 Sgr extracted during time intervals excluding the dip with the full SPEX model overlaid (top panel); for parameters, see Table 5. The rest-frame wavelengths of the dominant transitions are labelled. The middle panel shows the residuals, and the lower panel shows the residuals without the PION model.
Current usage metrics show cumulative count of Article Views (full-text article views including HTML views, PDF and ePub downloads, according to the available data) and Abstracts Views on Vision4Press platform.
Data correspond to usage on the plateform after 2015. The current usage metrics is available 48-96 hours after online publication and is updated daily on week days.
Initial download of the metrics may take a while.