Free Access
Fig. 15
Download original image
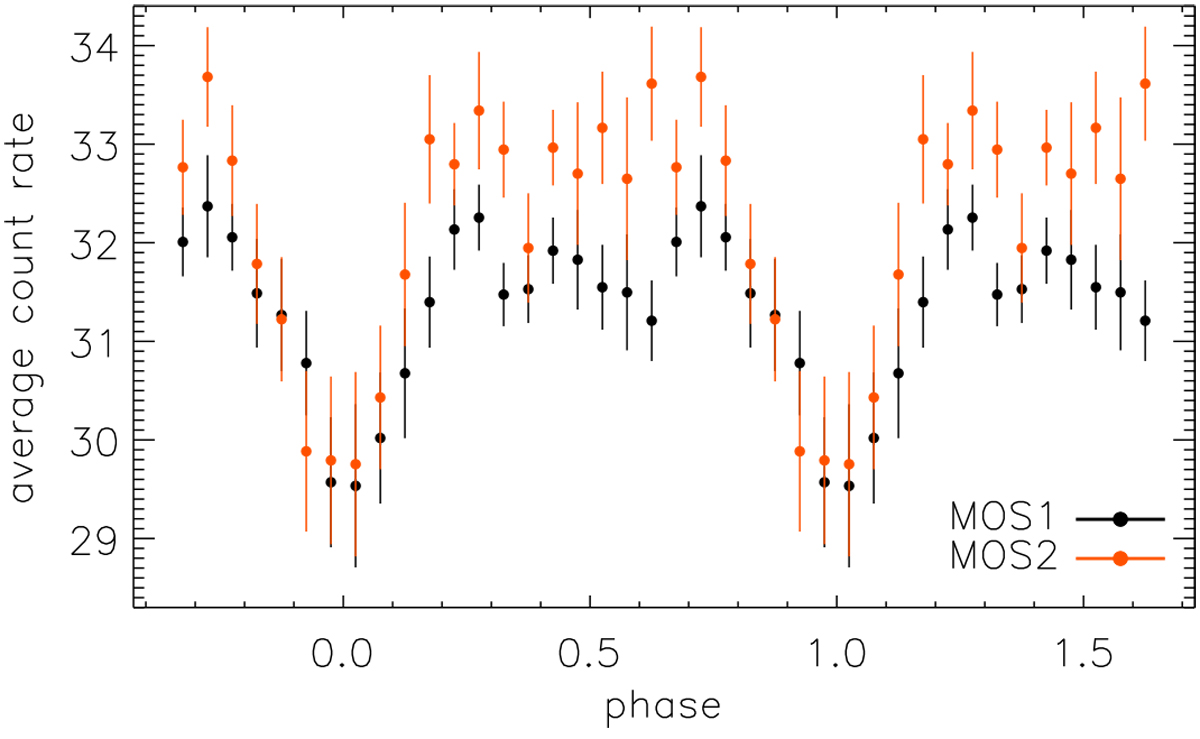
Phased MOS1 and MOS2 light curves for the post-dip episode, t3, assuming the frequency of 0.92 mHz. The points represent averaged values with error of the mean.
Current usage metrics show cumulative count of Article Views (full-text article views including HTML views, PDF and ePub downloads, according to the available data) and Abstracts Views on Vision4Press platform.
Data correspond to usage on the plateform after 2015. The current usage metrics is available 48-96 hours after online publication and is updated daily on week days.
Initial download of the metrics may take a while.