Fig. 14
Download original image
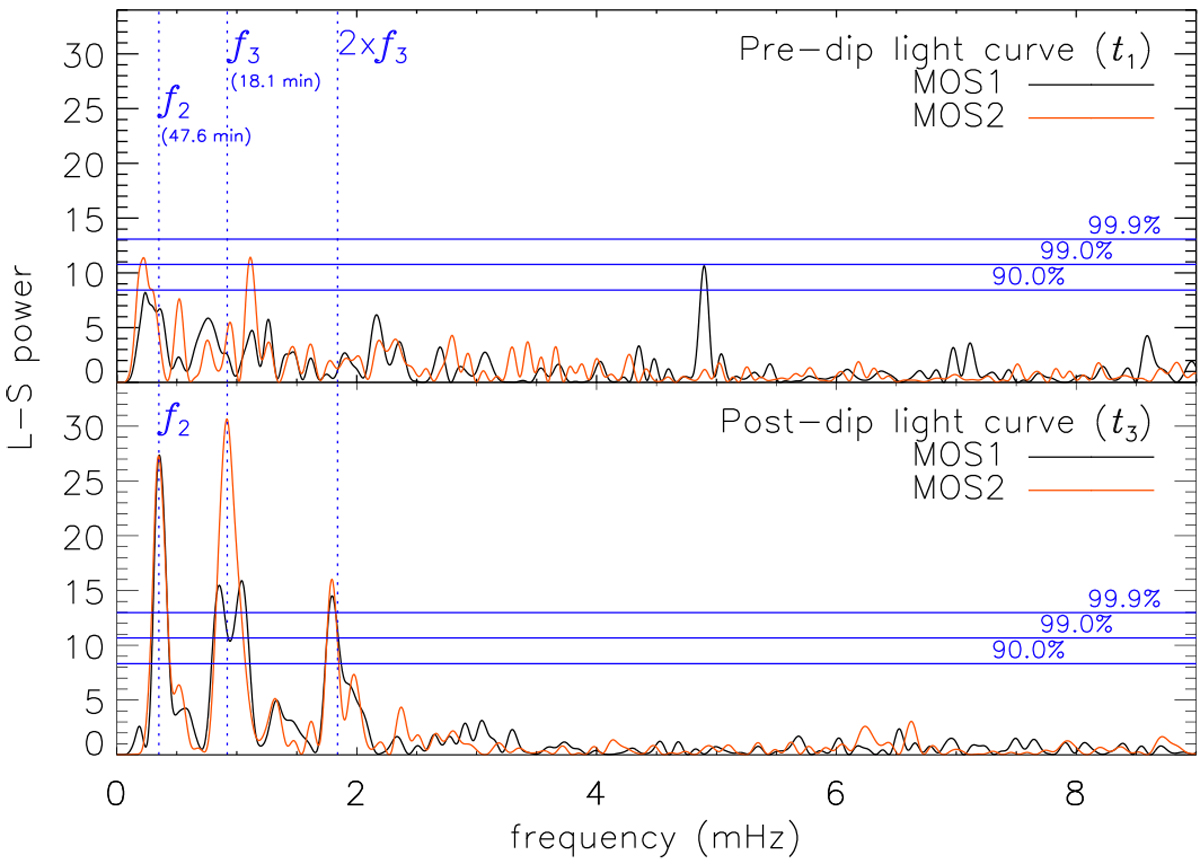
Periodograms of the detrended light curve segments t1 (pre-dip, toppanel) and t3 (post-dip, bottom panel) computed from the respective MOS1 (black) and MOS2 (orange) data. Vertical blue dotted lines represent the detected frequencies f2 = 0.35 mHz and f3 = 0.92 mHz with its first harmonics 2 × f3 ~ 1.84 mHz (see Table 4). Horizontal blue lines represent the 90, 99, and 99.9% confidence levels.
Current usage metrics show cumulative count of Article Views (full-text article views including HTML views, PDF and ePub downloads, according to the available data) and Abstracts Views on Vision4Press platform.
Data correspond to usage on the plateform after 2015. The current usage metrics is available 48-96 hours after online publication and is updated daily on week days.
Initial download of the metrics may take a while.