Fig. 12
Download original image
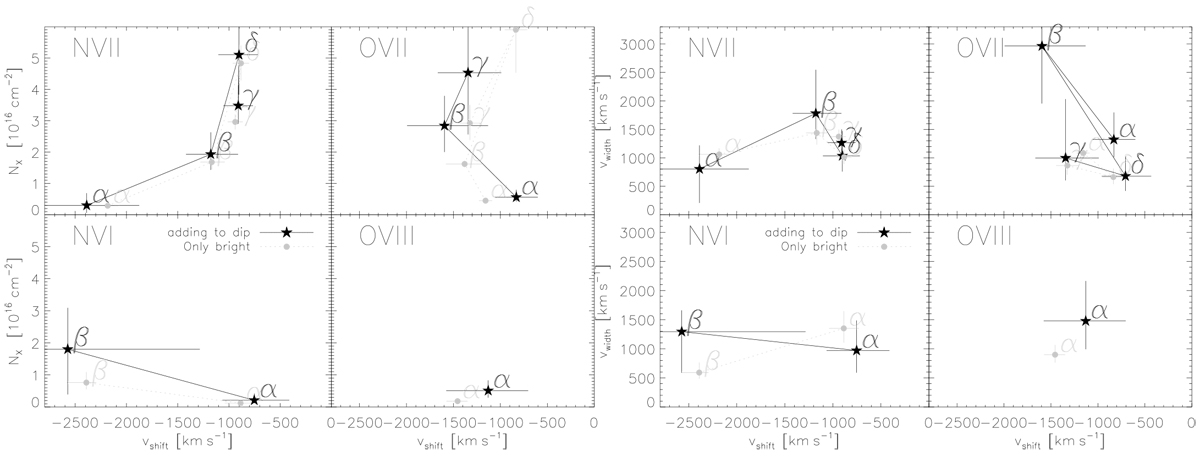
Results from absorption line profile fitting showing the line column densities in the left panel and the line widths in the right panel, both as functions of line shift. The black data points represent the results when assuming the dip spectrum to represent a ‘background’ source of the level emission observed during the dip (see bottom left panel of Fig. 11). The 1σ error bars are large because the measurement uncertainties of both the bright and dip spectra are taken into account. The grey data points represent results from simple fitting to the bright spectrum (see top left panel of Fig. 11). The instrumental line broadening (of order 300 km s−1) has notbeen taken into account. Except for some outliers (see Sect. 4.1), a fairly uniform value of line blueshift and line width can be identified of the order of 800− 1500 km s−1, which is animportant finding in relation to the interpretation of the global spectral modelling results described in Sect. 4.3.
Current usage metrics show cumulative count of Article Views (full-text article views including HTML views, PDF and ePub downloads, according to the available data) and Abstracts Views on Vision4Press platform.
Data correspond to usage on the plateform after 2015. The current usage metrics is available 48-96 hours after online publication and is updated daily on week days.
Initial download of the metrics may take a while.