Fig. 11
Download original image
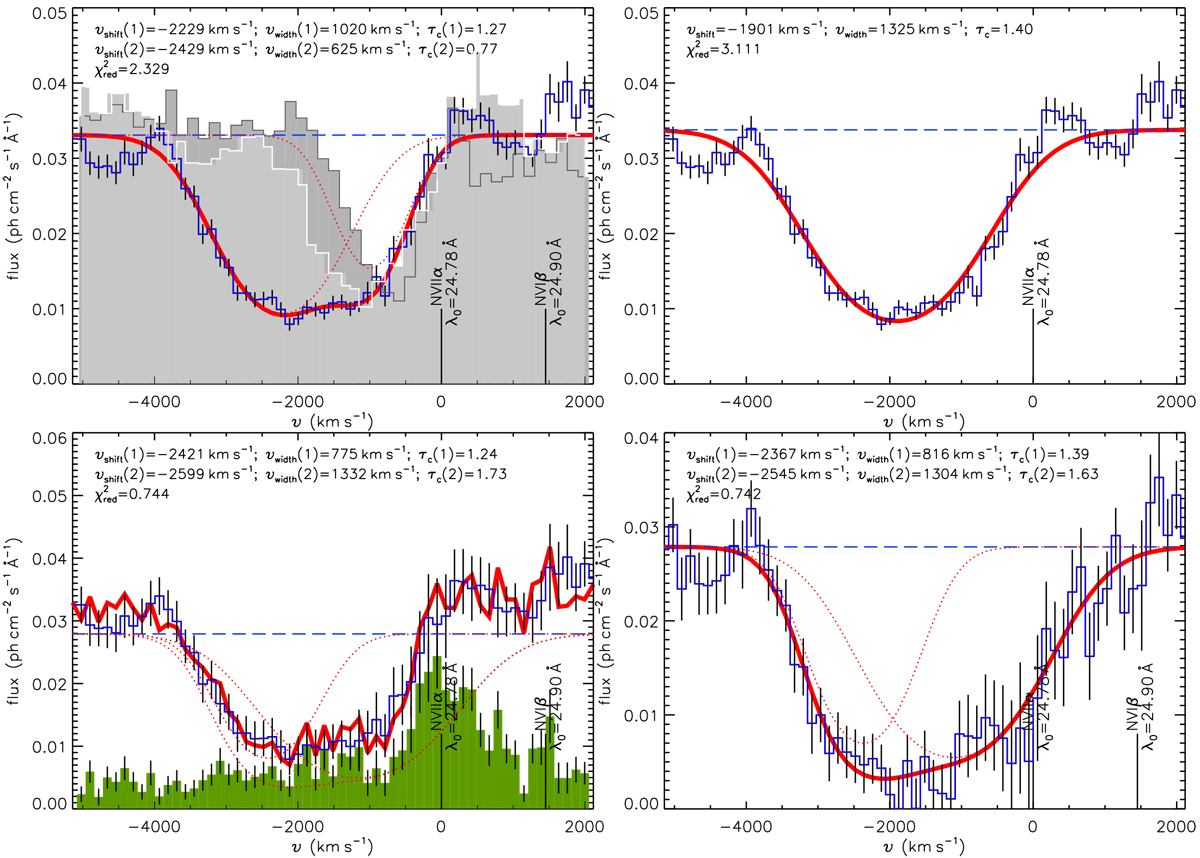
Absorption line profile fitting to the bright spectrum (blue histogram) following the concepts described by Ness et al. (2011) for the two blended lines of N VII (λ0 = 24.78Å) and N VI (λ0 = 24.90Å); labels are included in the rest frame of the N VII line with black vertical lines. The respective best-fit models are shown with a thickred line, the assumed continuum level with the dashed blue line, and the model components for each line with dotted red lines. Top left: for comparison, Chandra spectra of RS Oph taken on days 39 (ObsID 7296, light grey) and 67 (ObsID 7297, dark grey) are included, re-scaled to the assumed continuum level showing the absorption line in V3890 Sgr was much broader. Top right: only a single line is fitted assuming that all contributions come from the N VII line. Bottom left: assuming the emission during the dip was also present during the bright phases, the dip spectrum is added to the model in each iteration step. The thin red dotted line represents the model spectrum without the addition of the dip spectrum. Bottom right: model fit to the difference spectrum in the right panel of Fig. 7. The fit results ofall lines are given in Table 2. See Sect. 4.1 for discussion.
Current usage metrics show cumulative count of Article Views (full-text article views including HTML views, PDF and ePub downloads, according to the available data) and Abstracts Views on Vision4Press platform.
Data correspond to usage on the plateform after 2015. The current usage metrics is available 48-96 hours after online publication and is updated daily on week days.
Initial download of the metrics may take a while.