Fig. 10
Download original image
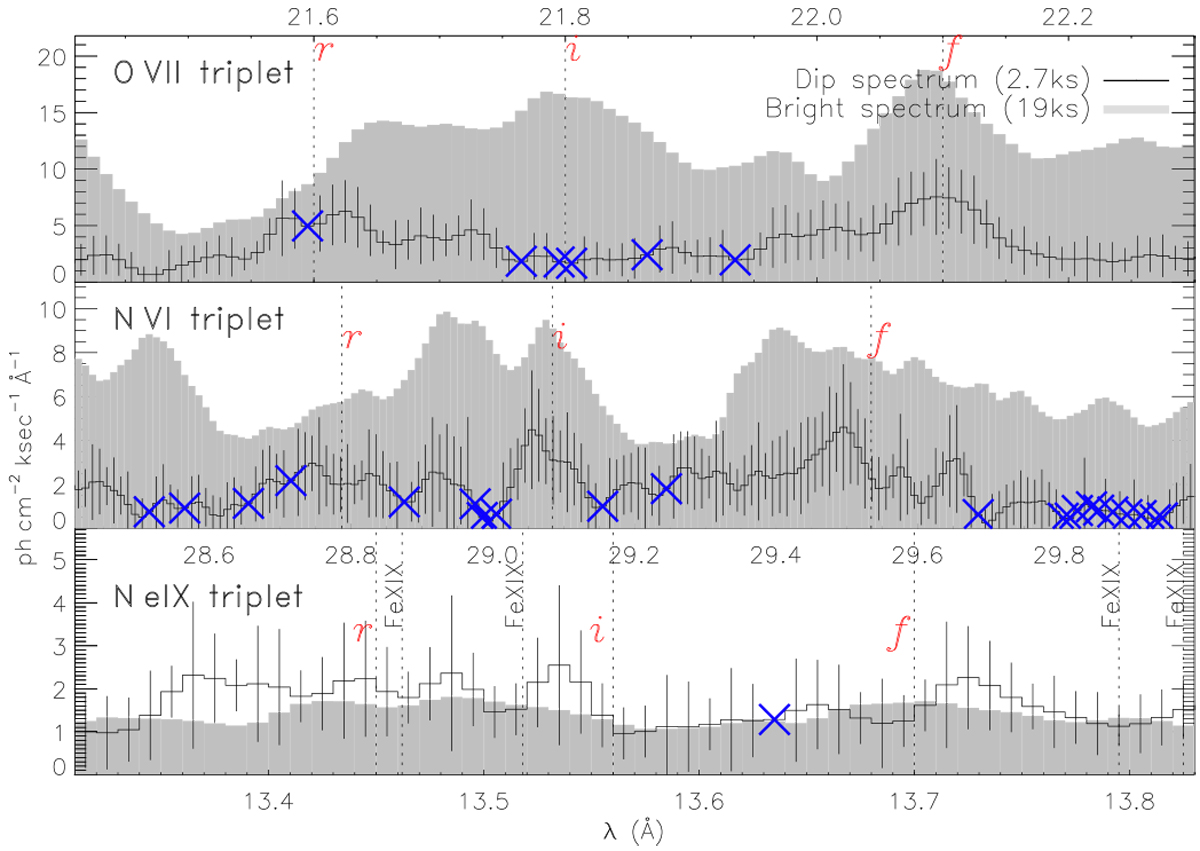
He-like triplet lines of O VII (top), N VI (middle), and Ne IX (bottom) during the dip (black histogram, 2.7 ks) and during the bright time intervals (light shadings, 19 ks). The blue crosses mark bad pixels with suspicious or invalid flux values. Dotted vertical lines mark the resonance (r: 1s2p 1P1) intercombination (i: 1s2p 3P1), and forbidden (f: 1s2s 3S1) lines. In thebottom panel, potentially blending lines of Fe XIX are also marked and labelled. All spectra are smoothed with a Gaussian kernel of 0.03 Å, the instrumental broadening, for better visualisation. See Sect. 3.2.4 for discussion.
Current usage metrics show cumulative count of Article Views (full-text article views including HTML views, PDF and ePub downloads, according to the available data) and Abstracts Views on Vision4Press platform.
Data correspond to usage on the plateform after 2015. The current usage metrics is available 48-96 hours after online publication and is updated daily on week days.
Initial download of the metrics may take a while.