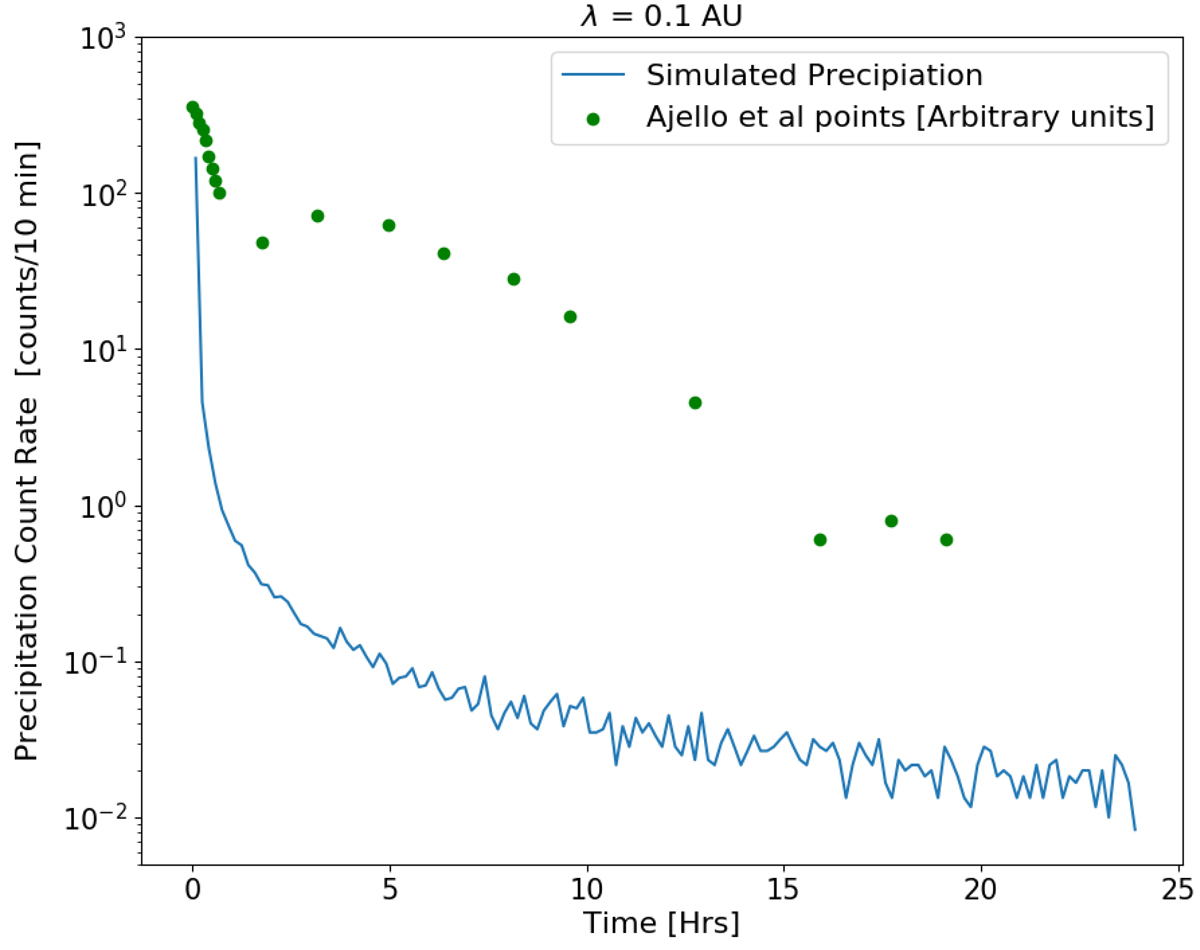
Fig. 8.
Download original image
Precipitation count rate versus time from a simulation with injection from a moving shock-like source with the same speed as the fastest 2012 March 7 shock (blue line), at 10 min resolution. The radial profile of particle injection is given by Eq. (10) with A = 1.0 R⊙, B = 1.58 and C = 6.0 R⊙. Green data points show the time evolution of the γ ray emission, from Ajello et al. (2014).
Current usage metrics show cumulative count of Article Views (full-text article views including HTML views, PDF and ePub downloads, according to the available data) and Abstracts Views on Vision4Press platform.
Data correspond to usage on the plateform after 2015. The current usage metrics is available 48-96 hours after online publication and is updated daily on week days.
Initial download of the metrics may take a while.