Fig. 7.
Download original image
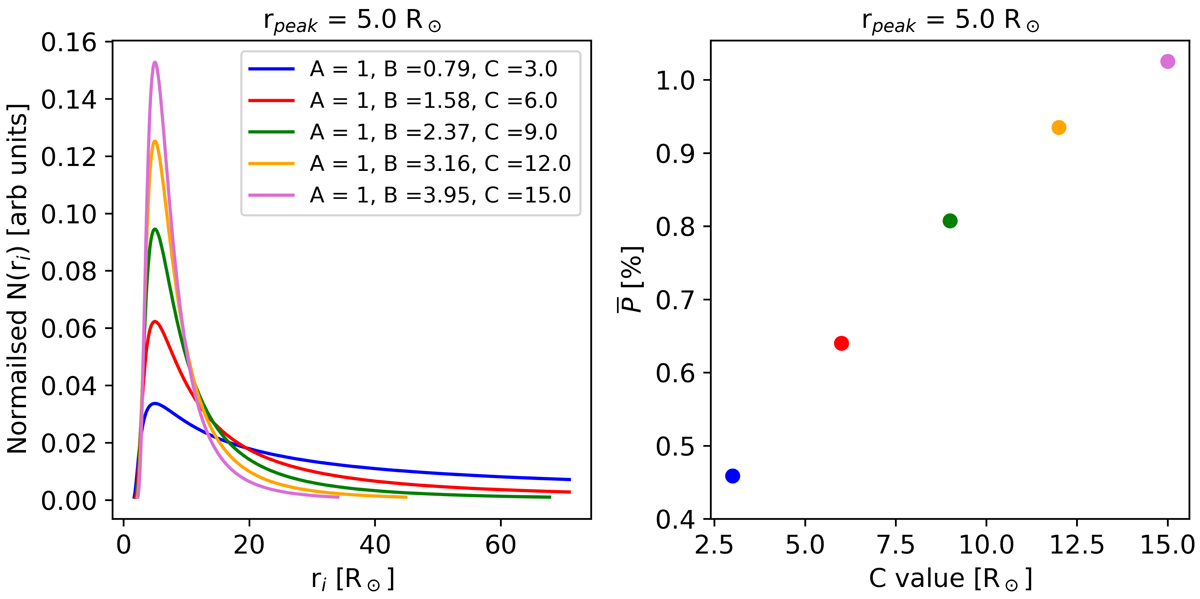
Normalised injection functions (left panel) with peak injection at 5.0 R⊙ and differing decay rates versus the radial position of the shock, ri. Only values of N(ri) > 0.001 were plotted for clarity. The corresponding total precipitation fraction (![]() , right panel) versus the value of the constant C. Each coloured point in the right panel represents
, right panel) versus the value of the constant C. Each coloured point in the right panel represents ![]() for the same coloured curve in the left panel, calculated using rini = 1.20 and rfin = 70.91 R⊙, for λ = 0.1 AU.
for the same coloured curve in the left panel, calculated using rini = 1.20 and rfin = 70.91 R⊙, for λ = 0.1 AU.
Current usage metrics show cumulative count of Article Views (full-text article views including HTML views, PDF and ePub downloads, according to the available data) and Abstracts Views on Vision4Press platform.
Data correspond to usage on the plateform after 2015. The current usage metrics is available 48-96 hours after online publication and is updated daily on week days.
Initial download of the metrics may take a while.