Fig. 5.
Download original image
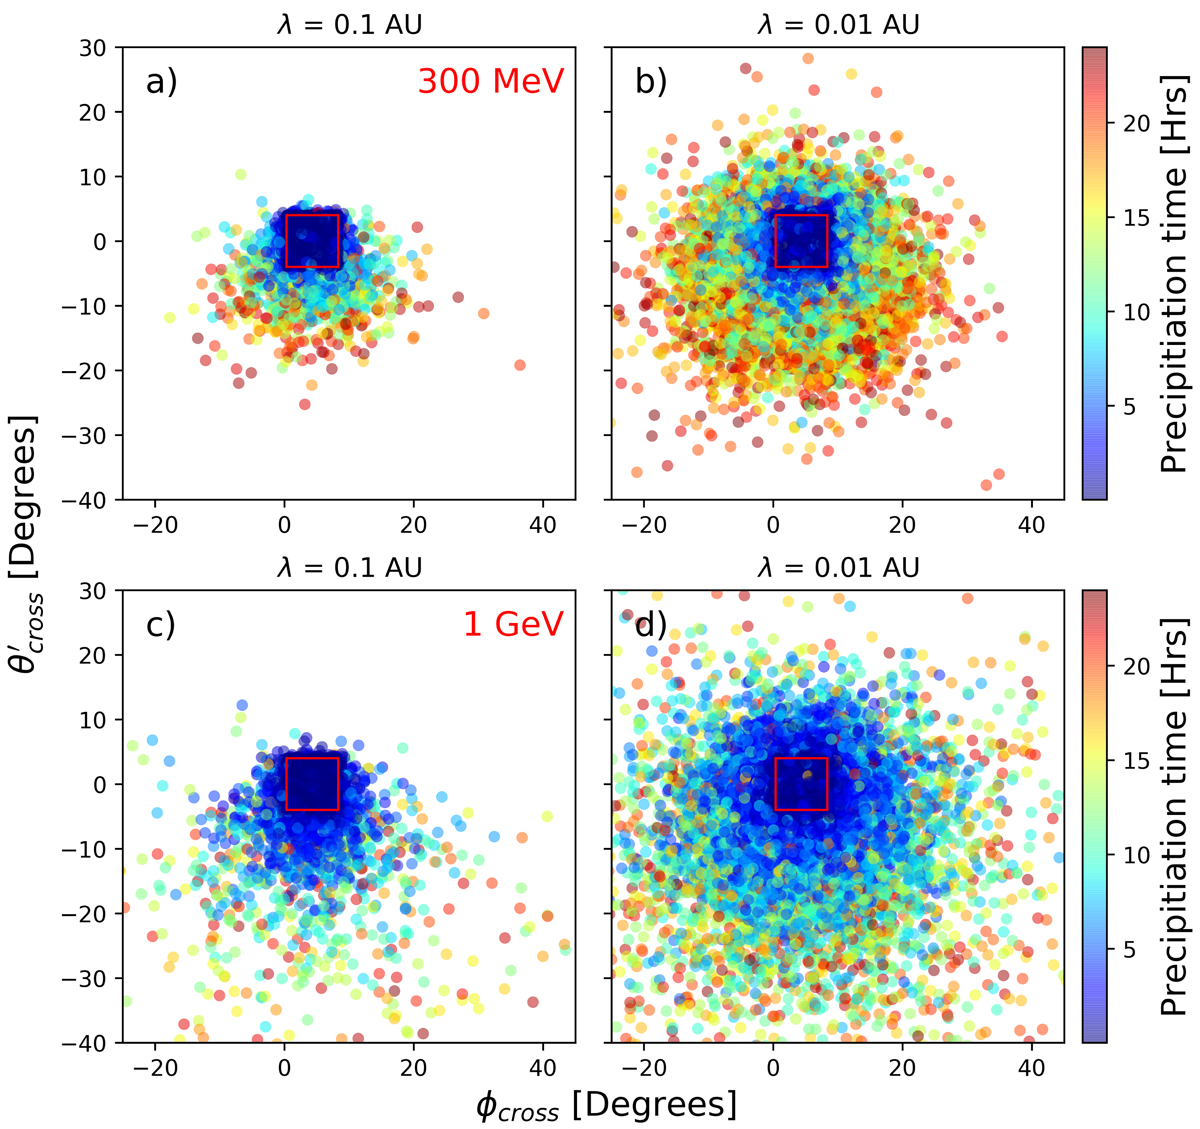
Heliographic latitude (![]() ) and longitude (ϕcross) of the locations where energetic protons reach the solar surface for simulations with; an 8° ×8° injection region (centred at 0°, 0°) at ri = 20 R⊙ and λ = 0.1 AU (panels a and c) and 0.01 AU (panels b and d). Panels a and b: are for a 300 MeV mono-energetic proton population, while c and d are for a 1 GeV population. The red box denotes the region on the solar surface that maps to the injection region. All panels are displaying −40 to 30° in latitude and −25 to 45° in longitude. The crossing positions of the 1 GeV simulations extend beyond these limits with particles in the λ = 0.01 AU simulation crossing 1 R⊙ between −82.5 to 97.6° in longitude and between −79.1 and 67.3° in latitude.
) and longitude (ϕcross) of the locations where energetic protons reach the solar surface for simulations with; an 8° ×8° injection region (centred at 0°, 0°) at ri = 20 R⊙ and λ = 0.1 AU (panels a and c) and 0.01 AU (panels b and d). Panels a and b: are for a 300 MeV mono-energetic proton population, while c and d are for a 1 GeV population. The red box denotes the region on the solar surface that maps to the injection region. All panels are displaying −40 to 30° in latitude and −25 to 45° in longitude. The crossing positions of the 1 GeV simulations extend beyond these limits with particles in the λ = 0.01 AU simulation crossing 1 R⊙ between −82.5 to 97.6° in longitude and between −79.1 and 67.3° in latitude.
Current usage metrics show cumulative count of Article Views (full-text article views including HTML views, PDF and ePub downloads, according to the available data) and Abstracts Views on Vision4Press platform.
Data correspond to usage on the plateform after 2015. The current usage metrics is available 48-96 hours after online publication and is updated daily on week days.
Initial download of the metrics may take a while.