Fig. 5.

Download original image
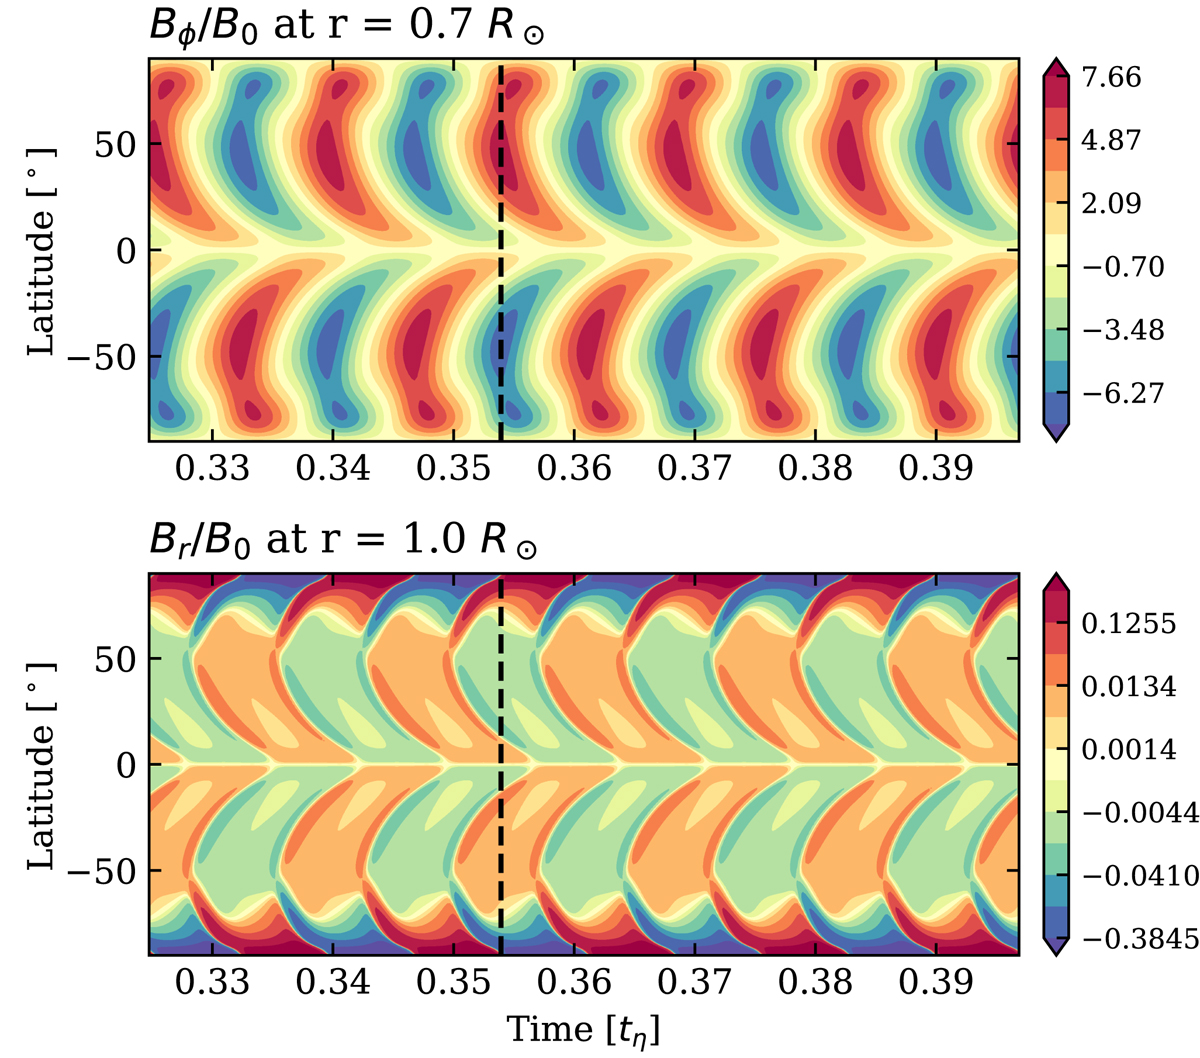
Butterfly diagram of solar Babcock-Leighton model with CS = 30 and D = 4.2 × 10⁶, for Bϕ at r = 0.7 and Br at the surface. As the radial component diagram is much more contrasted here, we propose some contours, using consistent colors, to illustrate weak patterns that are not saturated enough. The vertical dashed line corresponds to the reversal of poloidal field from negative to positive at the poles, coinciding with the positive maximum of toroidal field at the base of CZ. A logarithmic color scale has been chosen to represent the bottom panel.
Current usage metrics show cumulative count of Article Views (full-text article views including HTML views, PDF and ePub downloads, according to the available data) and Abstracts Views on Vision4Press platform.
Data correspond to usage on the plateform after 2015. The current usage metrics is available 48-96 hours after online publication and is updated daily on week days.
Initial download of the metrics may take a while.


