Fig. 9
Download original image
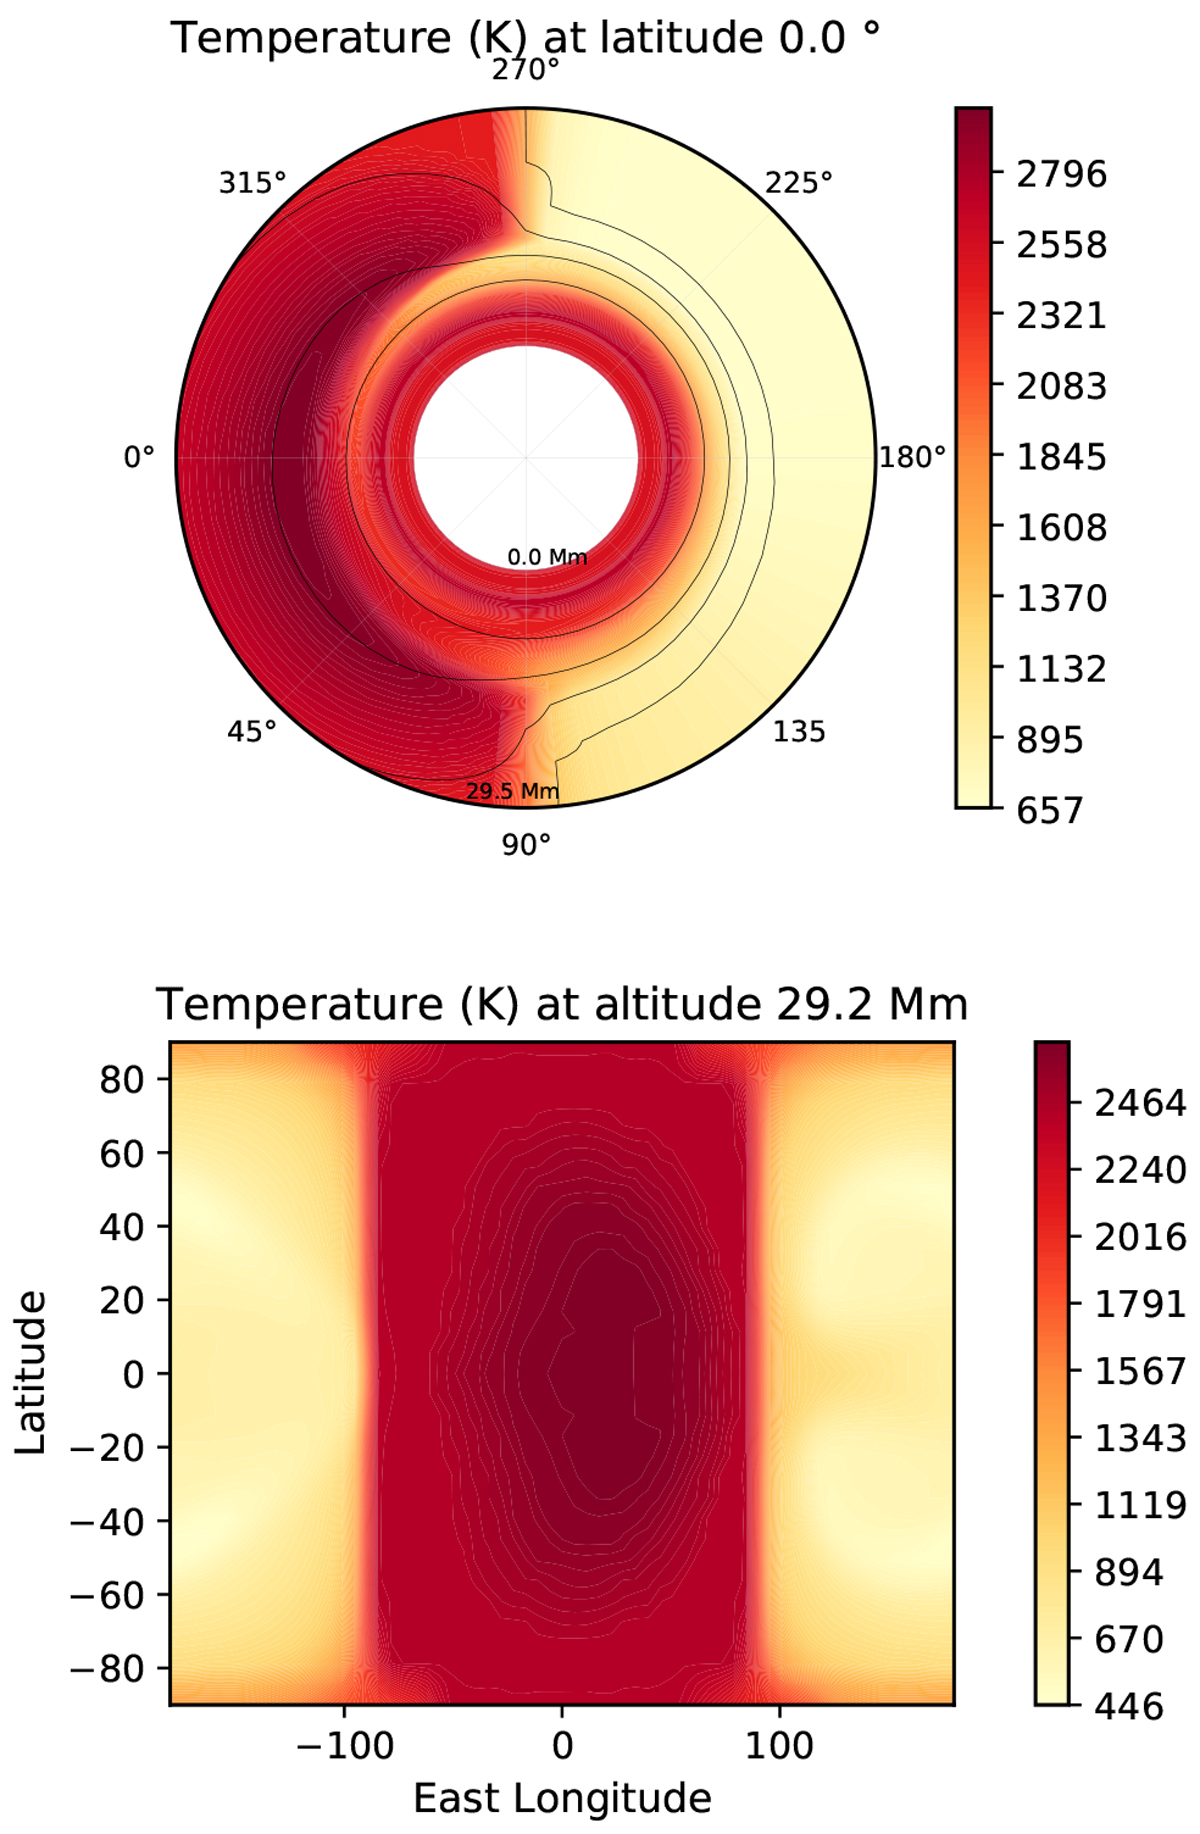
Temperature maps of WASP-121b. The top map shows an equatorial slice. The planet radius is divided by 10 for visual reasons. The black lines correspond to different isobar levels. The bottom map shows a slice at high altitude (29.2 Mm, i.e., 29 200 km). The hottest point is slightly shifted to the east limb, i.e., the trailing limb.
Current usage metrics show cumulative count of Article Views (full-text article views including HTML views, PDF and ePub downloads, according to the available data) and Abstracts Views on Vision4Press platform.
Data correspond to usage on the plateform after 2015. The current usage metrics is available 48-96 hours after online publication and is updated daily on week days.
Initial download of the metrics may take a while.