Fig. 8
Download original image
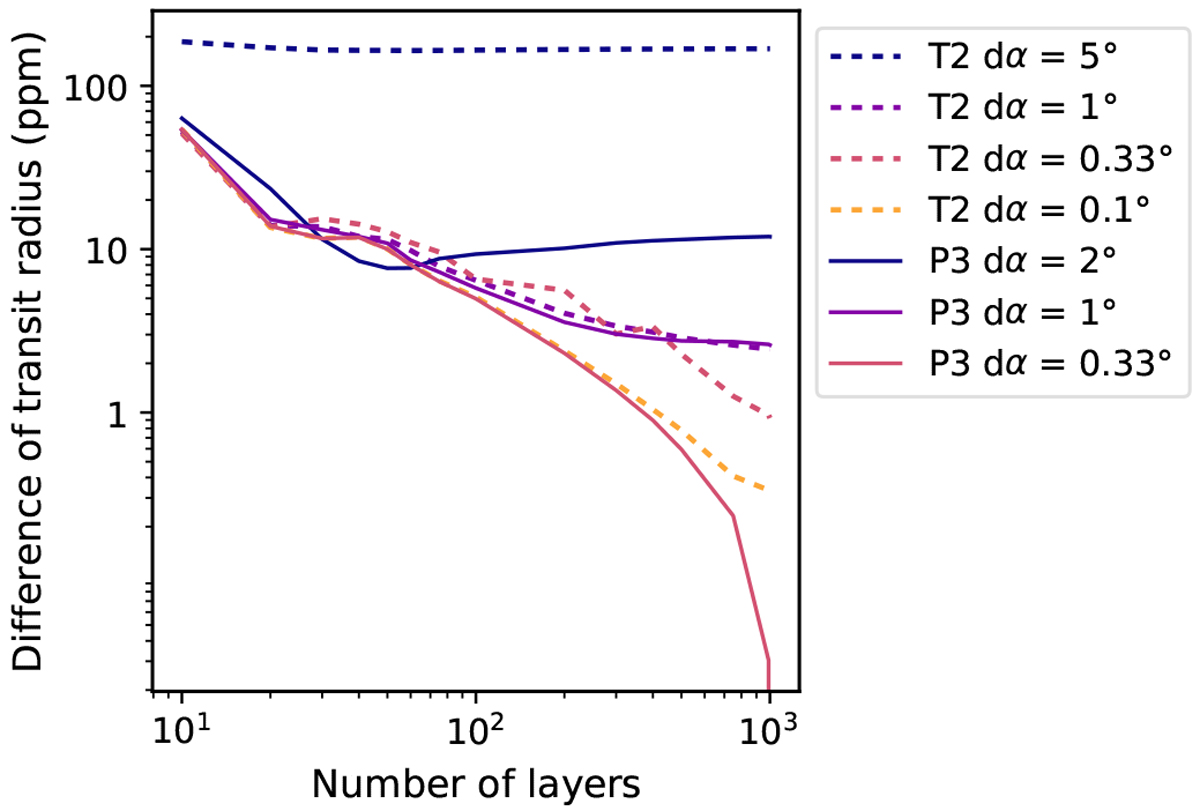
Convergence of TauREx 2D and Pytmosph3R when the atmospheric grid resolution is increased. The Y-axis indicates the average of the absolute difference over all wavelengths considered between each model and Pytmosph3R (![]() ) = (1000, 540). The X-axis indicates the number of layers
) = (1000, 540). The X-axis indicates the number of layers ![]() in the model. The legend indicates the angular resolution of the model, dα, equal to
in the model. The legend indicates the angular resolution of the model, dα, equal to ![]() for TauREx (T2) and
for TauREx (T2) and ![]() for Pytmosph3R (P3). For example, dα = 1°
leads to
for Pytmosph3R (P3). For example, dα = 1°
leads to ![]() and
and ![]() . Pytmosph3R was run with φ⋆ = 90° (see
Fig. 7), so that only one longitude and one azimuthal angle are necessary, i.e.,
. Pytmosph3R was run with φ⋆ = 90° (see
Fig. 7), so that only one longitude and one azimuthal angle are necessary, i.e.,
![]() .
.
Current usage metrics show cumulative count of Article Views (full-text article views including HTML views, PDF and ePub downloads, according to the available data) and Abstracts Views on Vision4Press platform.
Data correspond to usage on the plateform after 2015. The current usage metrics is available 48-96 hours after online publication and is updated daily on week days.
Initial download of the metrics may take a while.