Fig. 7
Download original image
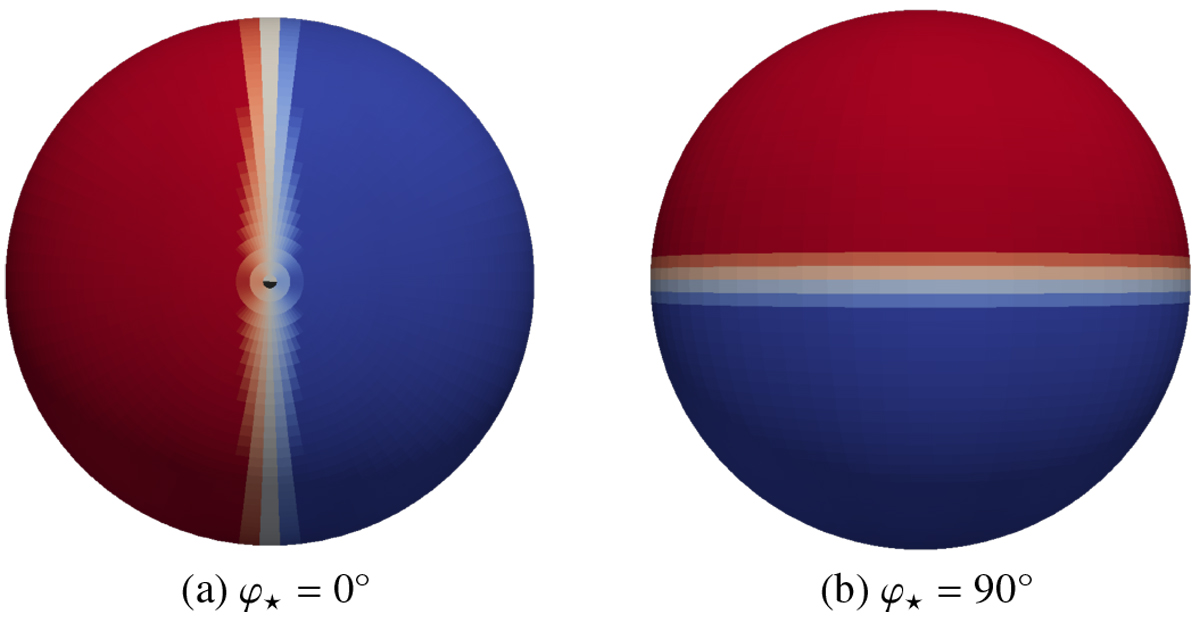
Discrete horizontal temperature maps at high altitude computed using Eq. (1) with 80/80 latitude and longitude grid points with two different choices of grid orientation (redder is hotter). These maps are visualized in 3D through ParaView (Ahrens et al. 2005). (a) The star is located in the equatorial plane (the planet is seen from the pole, with the star on the left). (b) The star is located at the pole (the star and the north pole are located at the top). In this idealized setup, choice b allows us to take advantage of the symmetries of the system and to use only one longitude point for our grid,which considerably speeds up the computation.
Current usage metrics show cumulative count of Article Views (full-text article views including HTML views, PDF and ePub downloads, according to the available data) and Abstracts Views on Vision4Press platform.
Data correspond to usage on the plateform after 2015. The current usage metrics is available 48-96 hours after online publication and is updated daily on week days.
Initial download of the metrics may take a while.