Fig. 4
Download original image
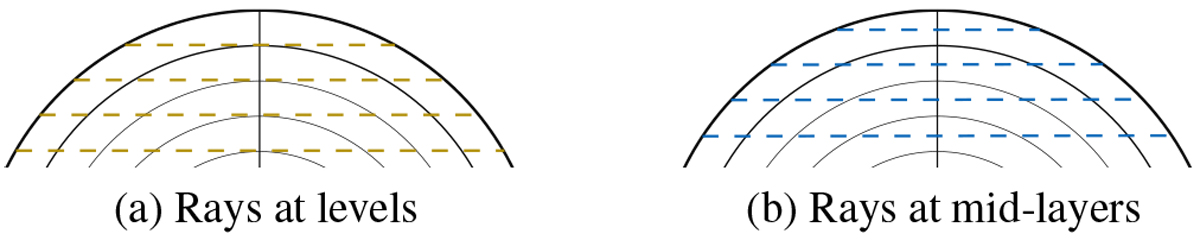
Schematic of the two possible methods for positioning the rays (dashed lines). In panel a, the rays are tangent to the pressurelevels (solid arcs), as done in TauREx 3.0. In panel b, the rays pass the middle of the layers, as done in Pytmosph3R and throughout this paper. A comparison of the accuracy of these two methods is shown in Fig. 5.
Current usage metrics show cumulative count of Article Views (full-text article views including HTML views, PDF and ePub downloads, according to the available data) and Abstracts Views on Vision4Press platform.
Data correspond to usage on the plateform after 2015. The current usage metrics is available 48-96 hours after online publication and is updated daily on week days.
Initial download of the metrics may take a while.