Open Access
Fig. 15
Download original image
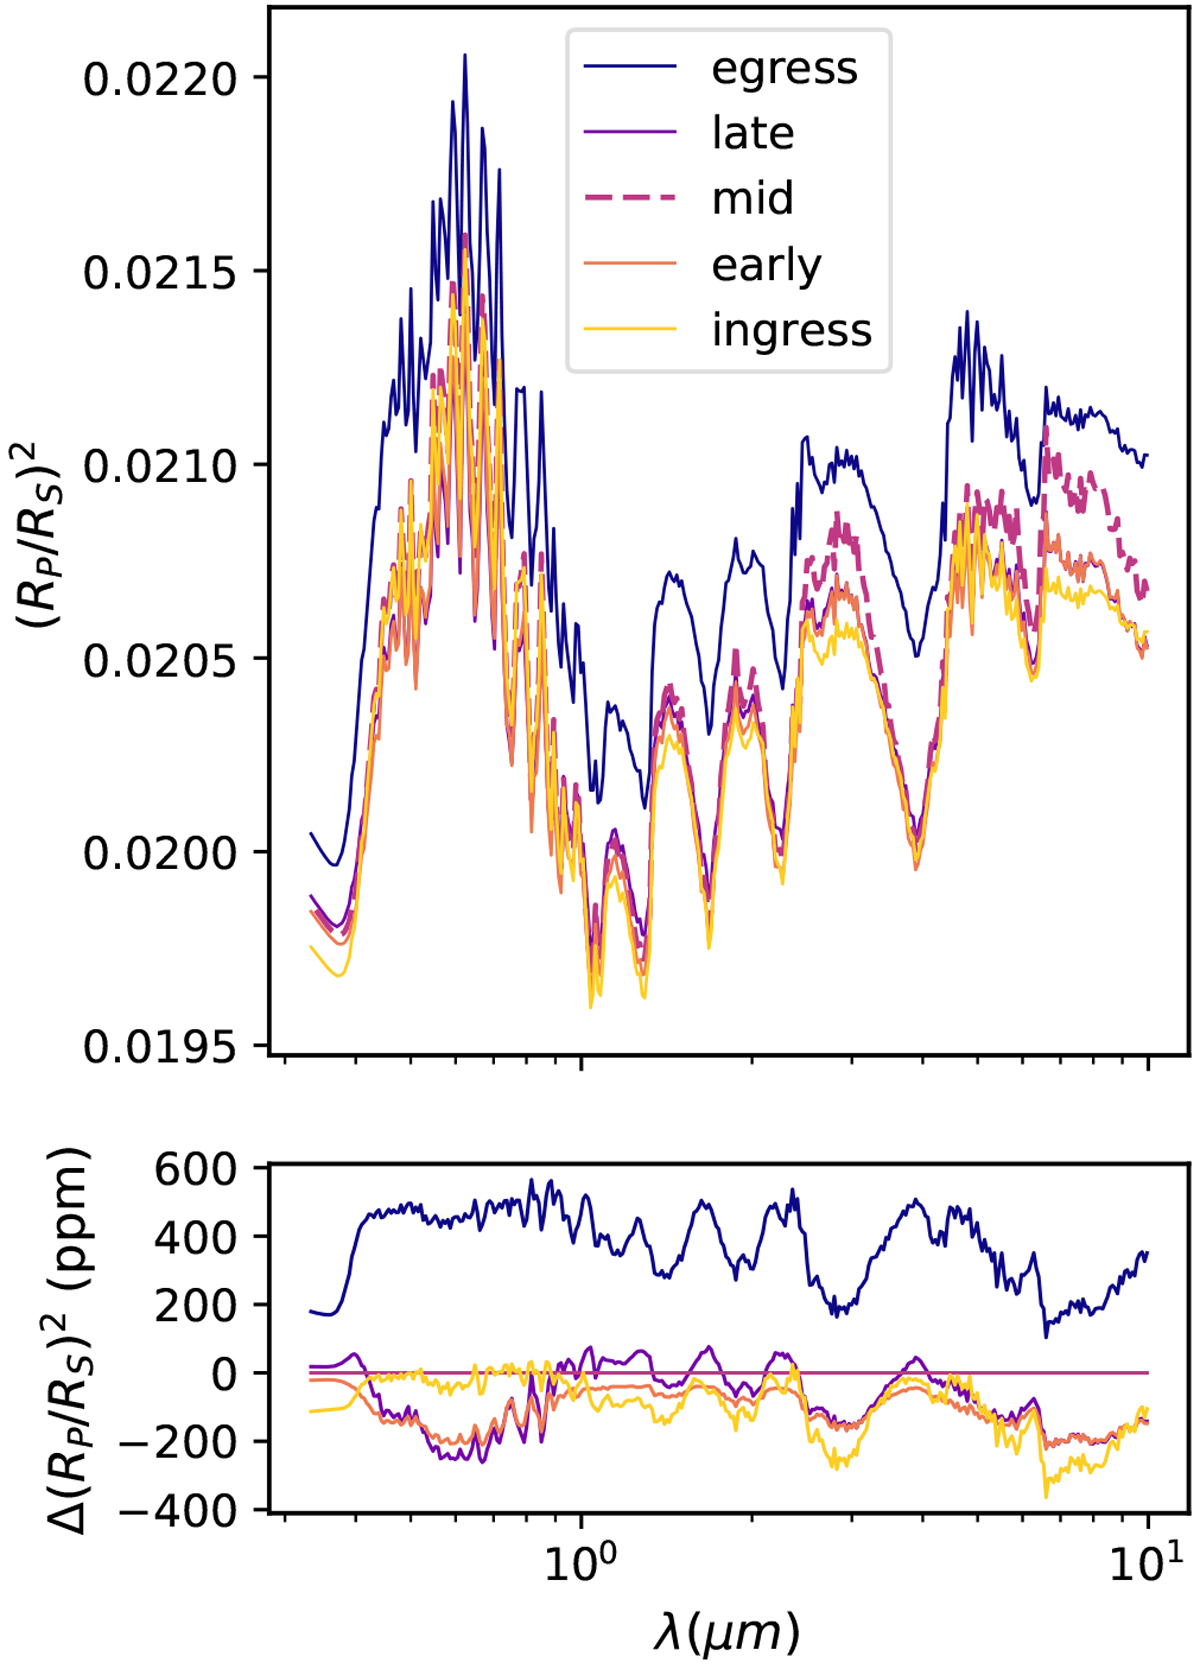
Spectral variations of the transit depth of WASP-121b during a transit for the phases listed in Fig. 14. The bottom plot shows the difference between each spectrum and the mid-transit spectrum, taken as a reference.
Current usage metrics show cumulative count of Article Views (full-text article views including HTML views, PDF and ePub downloads, according to the available data) and Abstracts Views on Vision4Press platform.
Data correspond to usage on the plateform after 2015. The current usage metrics is available 48-96 hours after online publication and is updated daily on week days.
Initial download of the metrics may take a while.