Fig. 1
Download original image
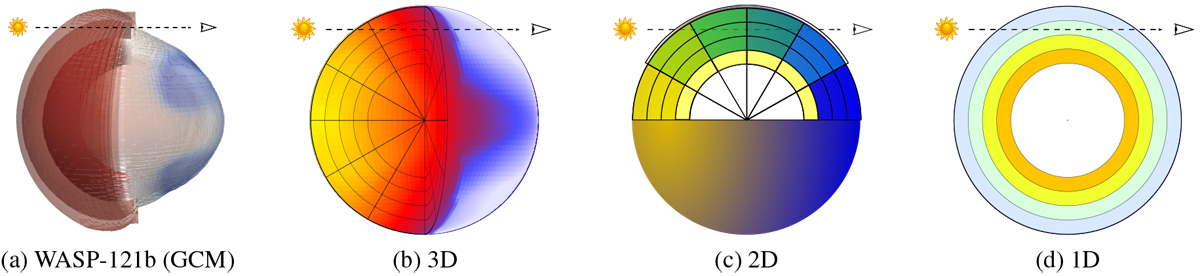
Visual representation of the dimensions of the models we considered using an equatorial view seen from the east. The colors of (a) indicate the temperature (redder is hotter) at isobar levels. The higher temperature on the dayside (on the left) affects the scale height, enlarging the atmosphere. The 3D model (b) follows a spherical (radius, latitude, longitude) coordinate system, while the 2D model (c) uses a polar grid whose the radial axis is the altitude and whose angular axis follows the solar altitude angle (which incidentally is also the angle of the zenith of the considered point with the zenith of the terminator). The 1D model (d) simply relies on the altitude.
Current usage metrics show cumulative count of Article Views (full-text article views including HTML views, PDF and ePub downloads, according to the available data) and Abstracts Views on Vision4Press platform.
Data correspond to usage on the plateform after 2015. The current usage metrics is available 48-96 hours after online publication and is updated daily on week days.
Initial download of the metrics may take a while.