Free Access
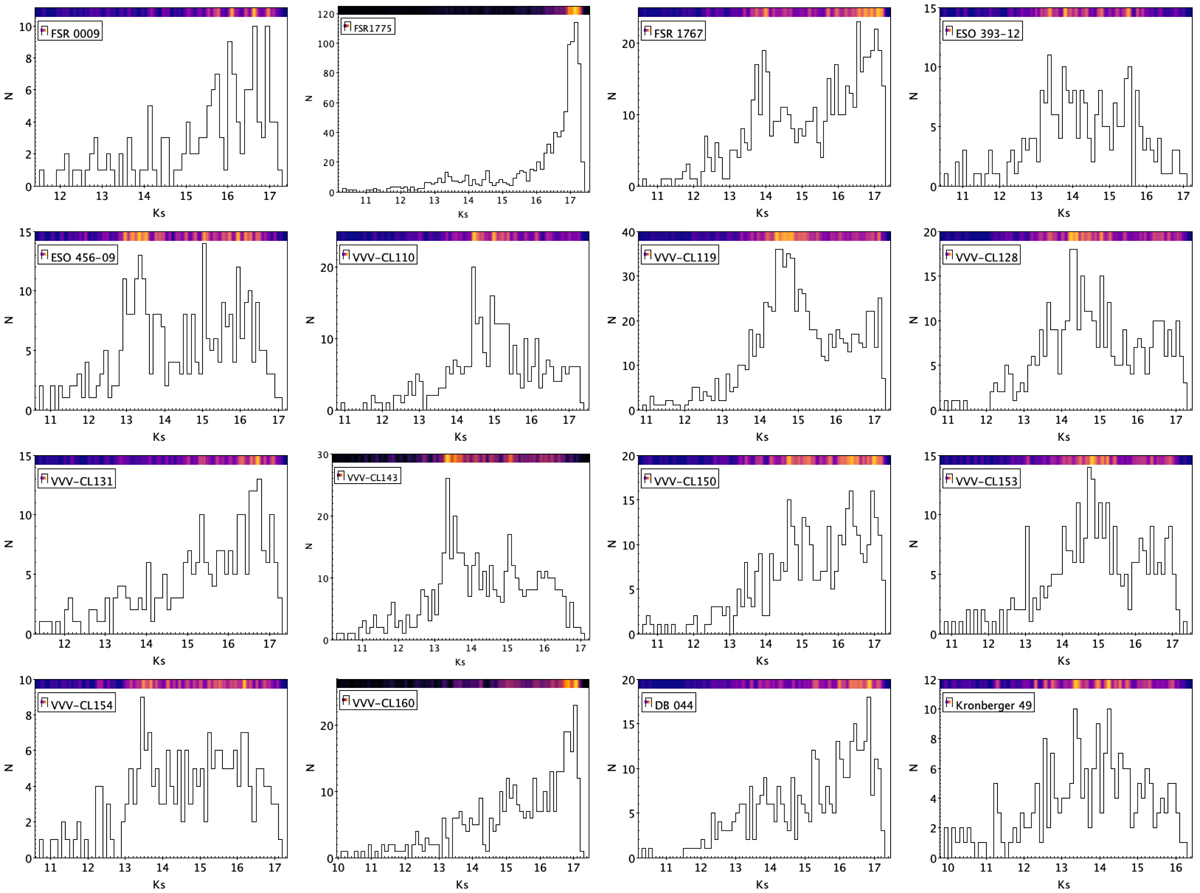
Fig. 7.
Download original image
Luminosity functions in Ks-band for each star cluster. Top: densogram used in order to more easily recognise the RC and avoid the binning dependence. The yellow colour depicts the highest density, with density decreasing towards magenta and then dark blue. We use a bin size of 0.1.
Current usage metrics show cumulative count of Article Views (full-text article views including HTML views, PDF and ePub downloads, according to the available data) and Abstracts Views on Vision4Press platform.
Data correspond to usage on the plateform after 2015. The current usage metrics is available 48-96 hours after online publication and is updated daily on week days.
Initial download of the metrics may take a while.