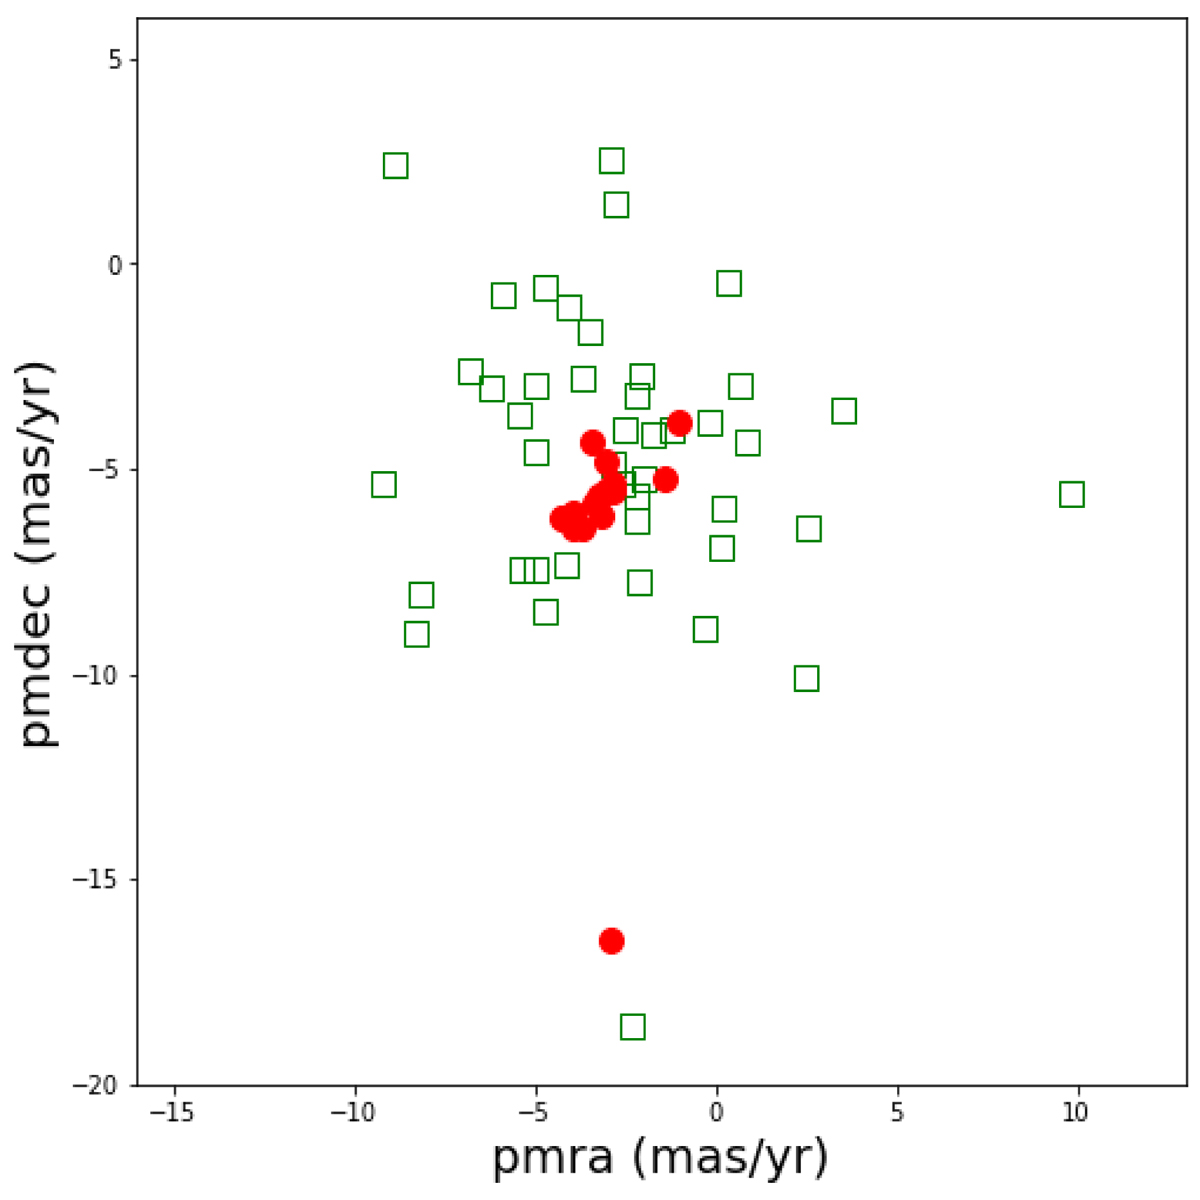
Fig. 4.
Download original image
Vector PMs shown to demonstrate that the kinematics of the star clusters analysed here are consistent with those of the known GCs located in the direction of the MW bulge. Our targets are highlighted with red points, whereas the known GCs located in the bulge within −10 < l(deg) < 10 and −10 < b(deg) < 10 are represented by open green squares.
Current usage metrics show cumulative count of Article Views (full-text article views including HTML views, PDF and ePub downloads, according to the available data) and Abstracts Views on Vision4Press platform.
Data correspond to usage on the plateform after 2015. The current usage metrics is available 48-96 hours after online publication and is updated daily on week days.
Initial download of the metrics may take a while.