Fig. 3.
Download original image
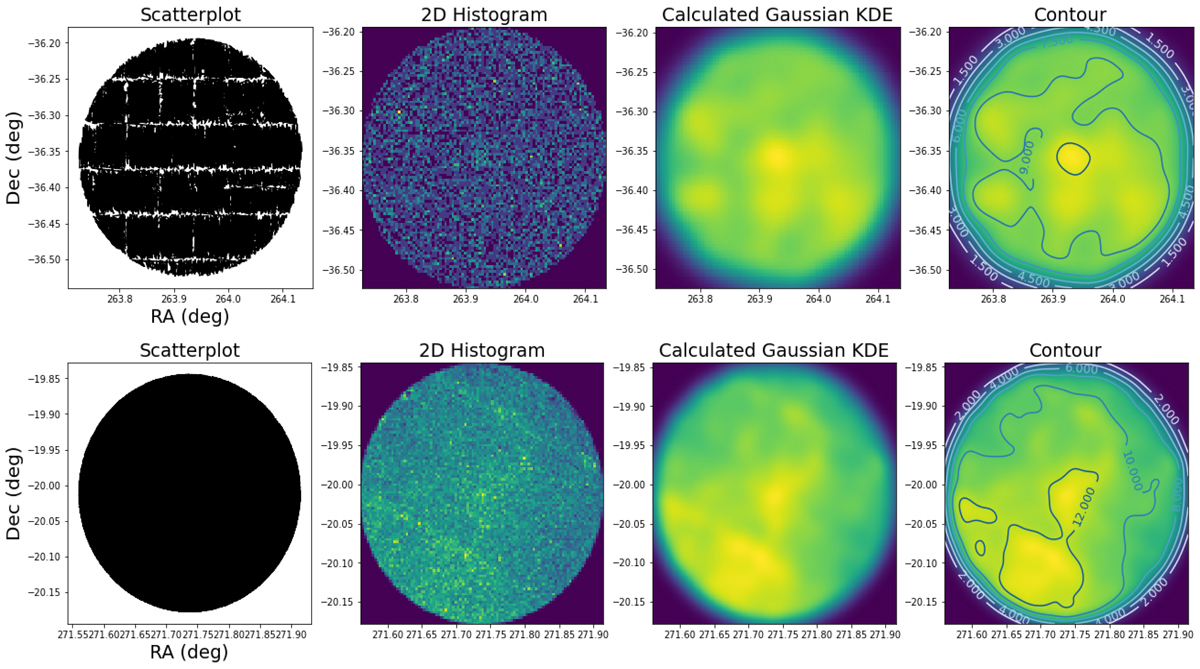
KDE technique applied to select the likely size of a cluster during the decontamination procedure. From left to right: scatterplot, 2D Histogram, Gaussian KDE, and 2D density with contours are shown for FSR 1767 (top panels) and VVV-CL160 (bottom panels) fields, which are used as representative. Green and yellow areas are illustrative of over-densities, while the blue areas show lower densities.
Current usage metrics show cumulative count of Article Views (full-text article views including HTML views, PDF and ePub downloads, according to the available data) and Abstracts Views on Vision4Press platform.
Data correspond to usage on the plateform after 2015. The current usage metrics is available 48-96 hours after online publication and is updated daily on week days.
Initial download of the metrics may take a while.