Fig. 2.
Download original image
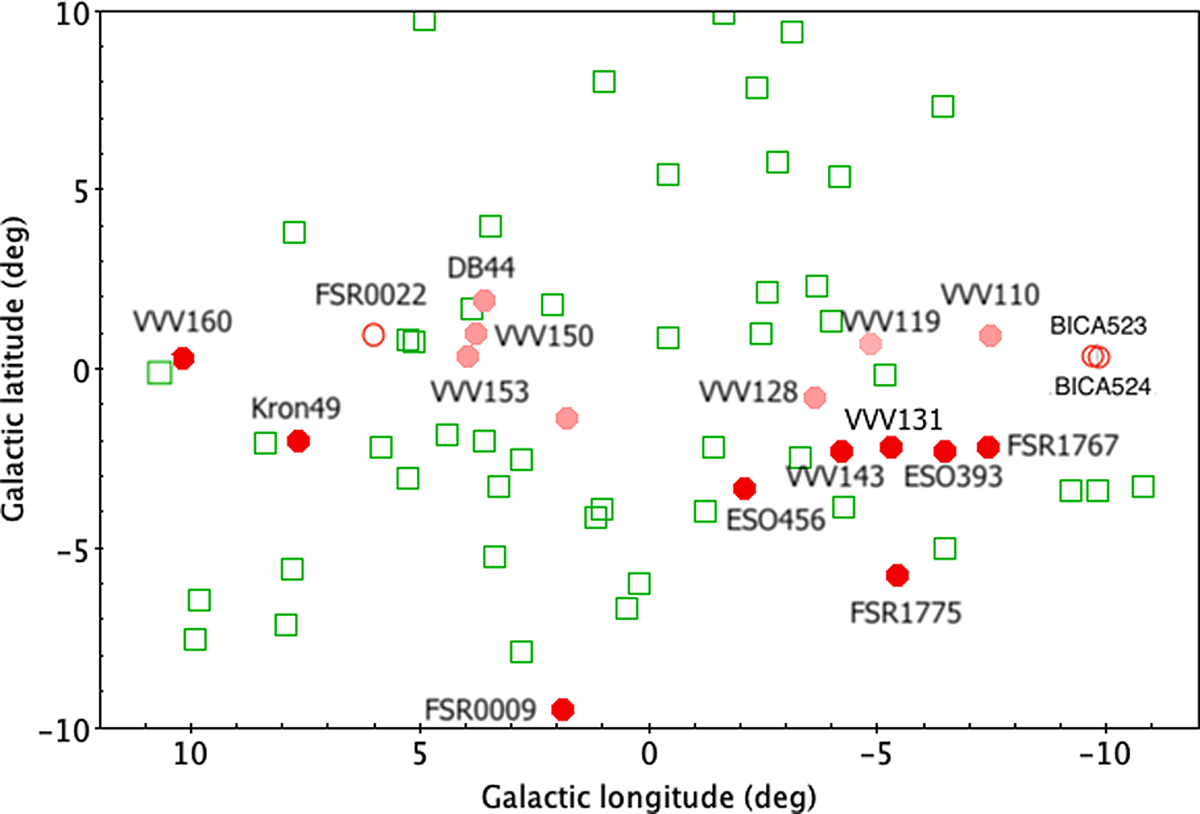
Map depicting Galactic latitude versus longitude for our sample. The confirmed GCs are highlighted as red points, whereas transparent red points are used to point out the unconfirmed GCs. We also mark with open red circles the open clusters excluded from our analysis. We show known GGs from Vasiliev & Baumgardt (2021) with open green squares for comparison. We use shorter cluster identifications only for our convenience.
Current usage metrics show cumulative count of Article Views (full-text article views including HTML views, PDF and ePub downloads, according to the available data) and Abstracts Views on Vision4Press platform.
Data correspond to usage on the plateform after 2015. The current usage metrics is available 48-96 hours after online publication and is updated daily on week days.
Initial download of the metrics may take a while.