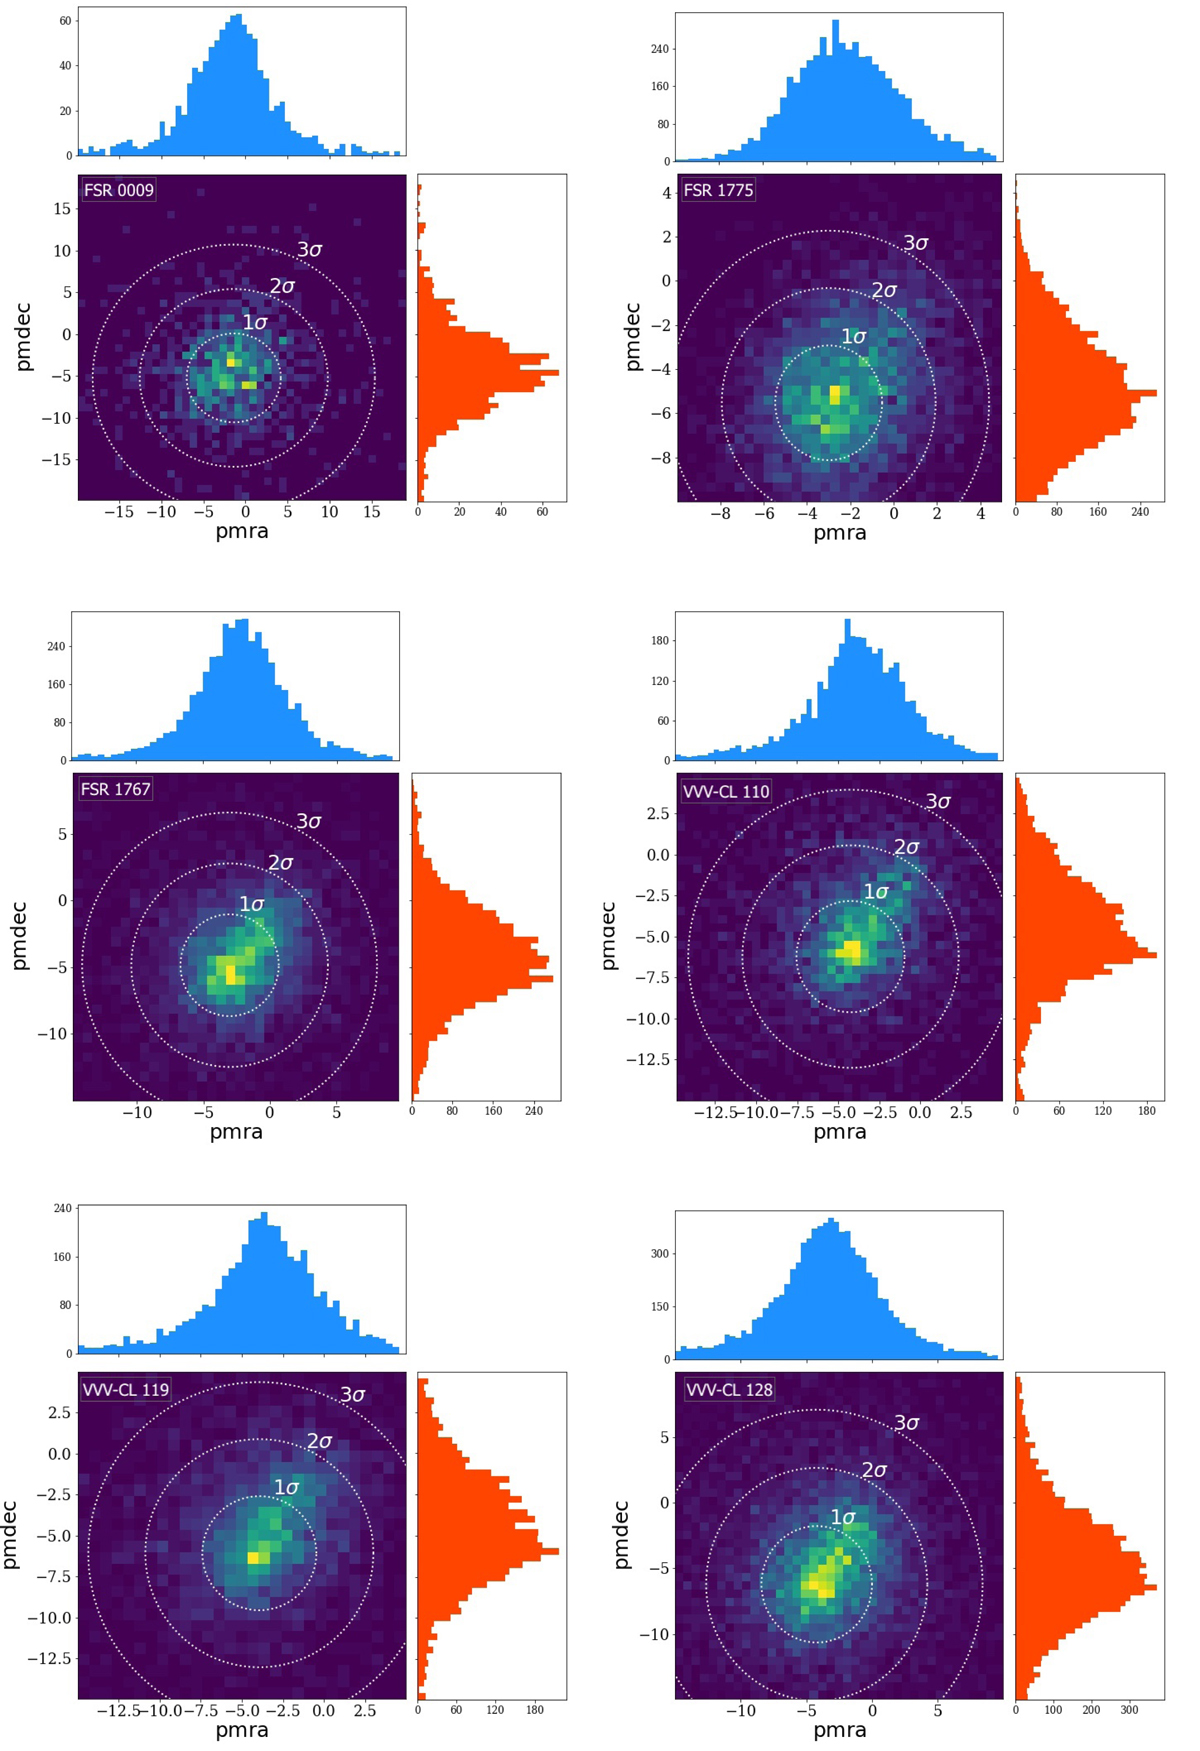
Fig. A.1.
Download original image
VPM, as 2D histogram diagram, of the stars in the cluster regions within the given radius r from its centre. Yellow areas are representative of over-densities, which become green and blue when the density decreases. White dot circles depict the 1σ, 2σ, and 3σ from the mean cluster PM value. On the top and on the right panels, we show the corresponding PM histograms, pmra (blue), and pmdec (red), respectively. We use a different bin size depending on the crowding of the areas. We add an insert for the VVV-CL160 cluster in order to make the PM over-density much more visible.
Current usage metrics show cumulative count of Article Views (full-text article views including HTML views, PDF and ePub downloads, according to the available data) and Abstracts Views on Vision4Press platform.
Data correspond to usage on the plateform after 2015. The current usage metrics is available 48-96 hours after online publication and is updated daily on week days.
Initial download of the metrics may take a while.