Free Access
Fig. 1.
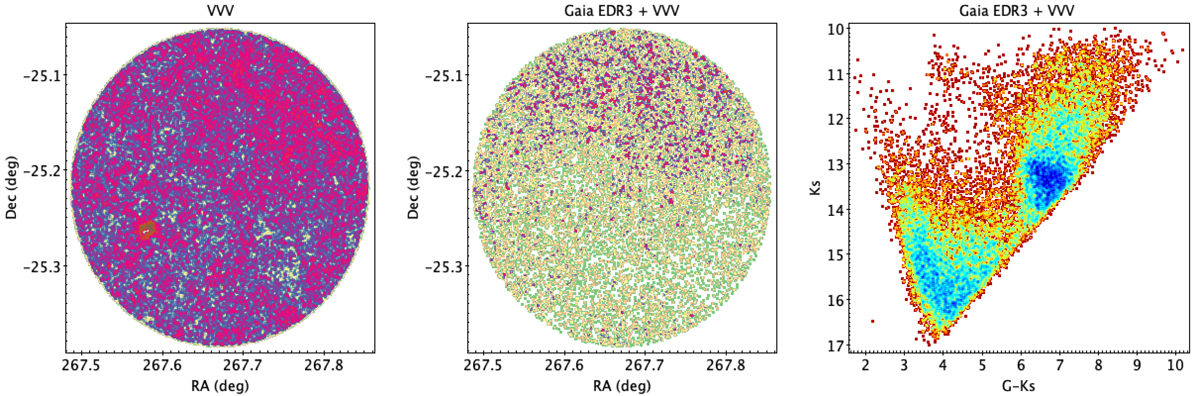
Download original image
VVV (on the left) and Gaia+VVV (in the middle) density maps for a r = 10′ field centred on VVV-CL150, which is used as a representative cluster. The redder areas are representative of over-densities, while the yellower areas are lower densities. The Gaia EDR3 + VVV CMD (on the right) is displayed for the same field.
Current usage metrics show cumulative count of Article Views (full-text article views including HTML views, PDF and ePub downloads, according to the available data) and Abstracts Views on Vision4Press platform.
Data correspond to usage on the plateform after 2015. The current usage metrics is available 48-96 hours after online publication and is updated daily on week days.
Initial download of the metrics may take a while.