Free Access
Fig. 8.
Download original image
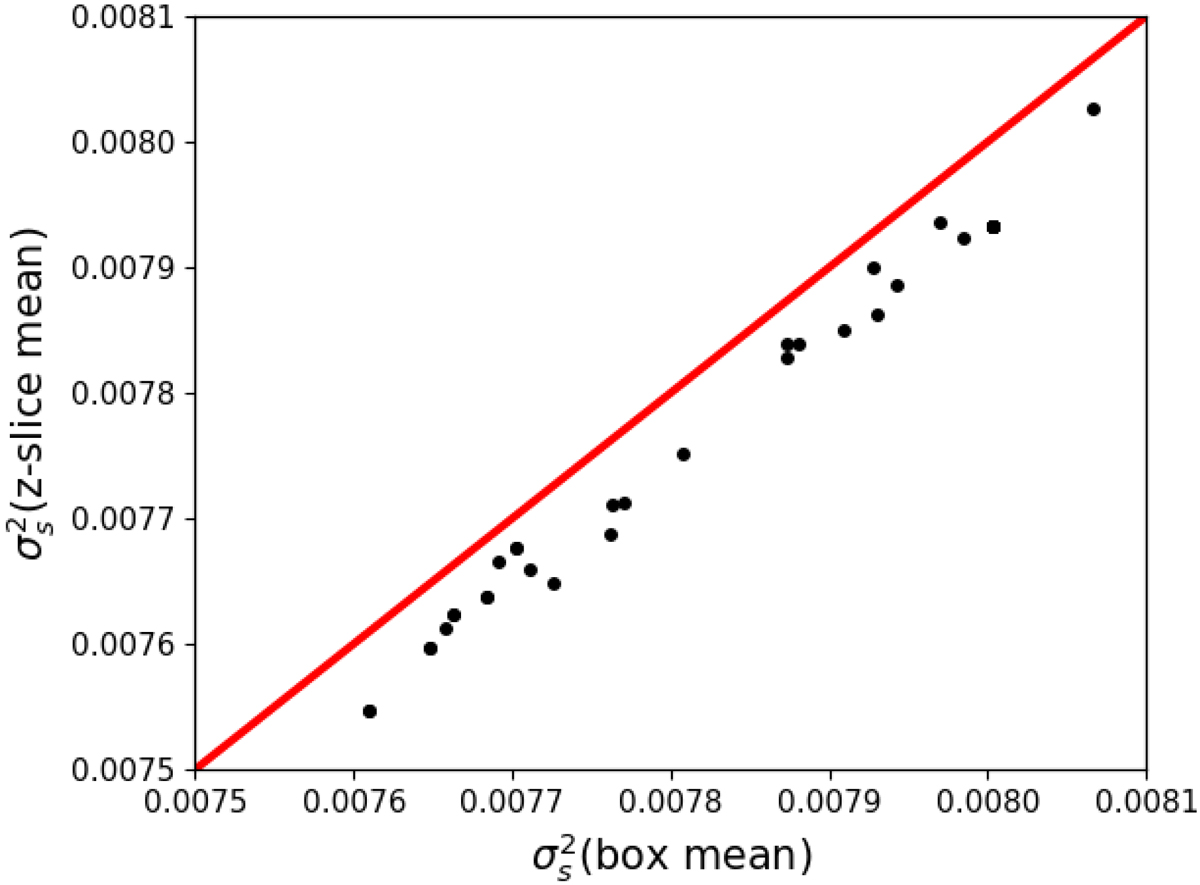
A comparison between the logarithmic density fluctuations estimated with a fixed scale filtering method and calculating the density mean in slices at a given z coordinate. The red line is the bisector, which highlights the one-to-one relation.
Current usage metrics show cumulative count of Article Views (full-text article views including HTML views, PDF and ePub downloads, according to the available data) and Abstracts Views on Vision4Press platform.
Data correspond to usage on the plateform after 2015. The current usage metrics is available 48-96 hours after online publication and is updated daily on week days.
Initial download of the metrics may take a while.