Free Access
Fig. 4.
Download original image
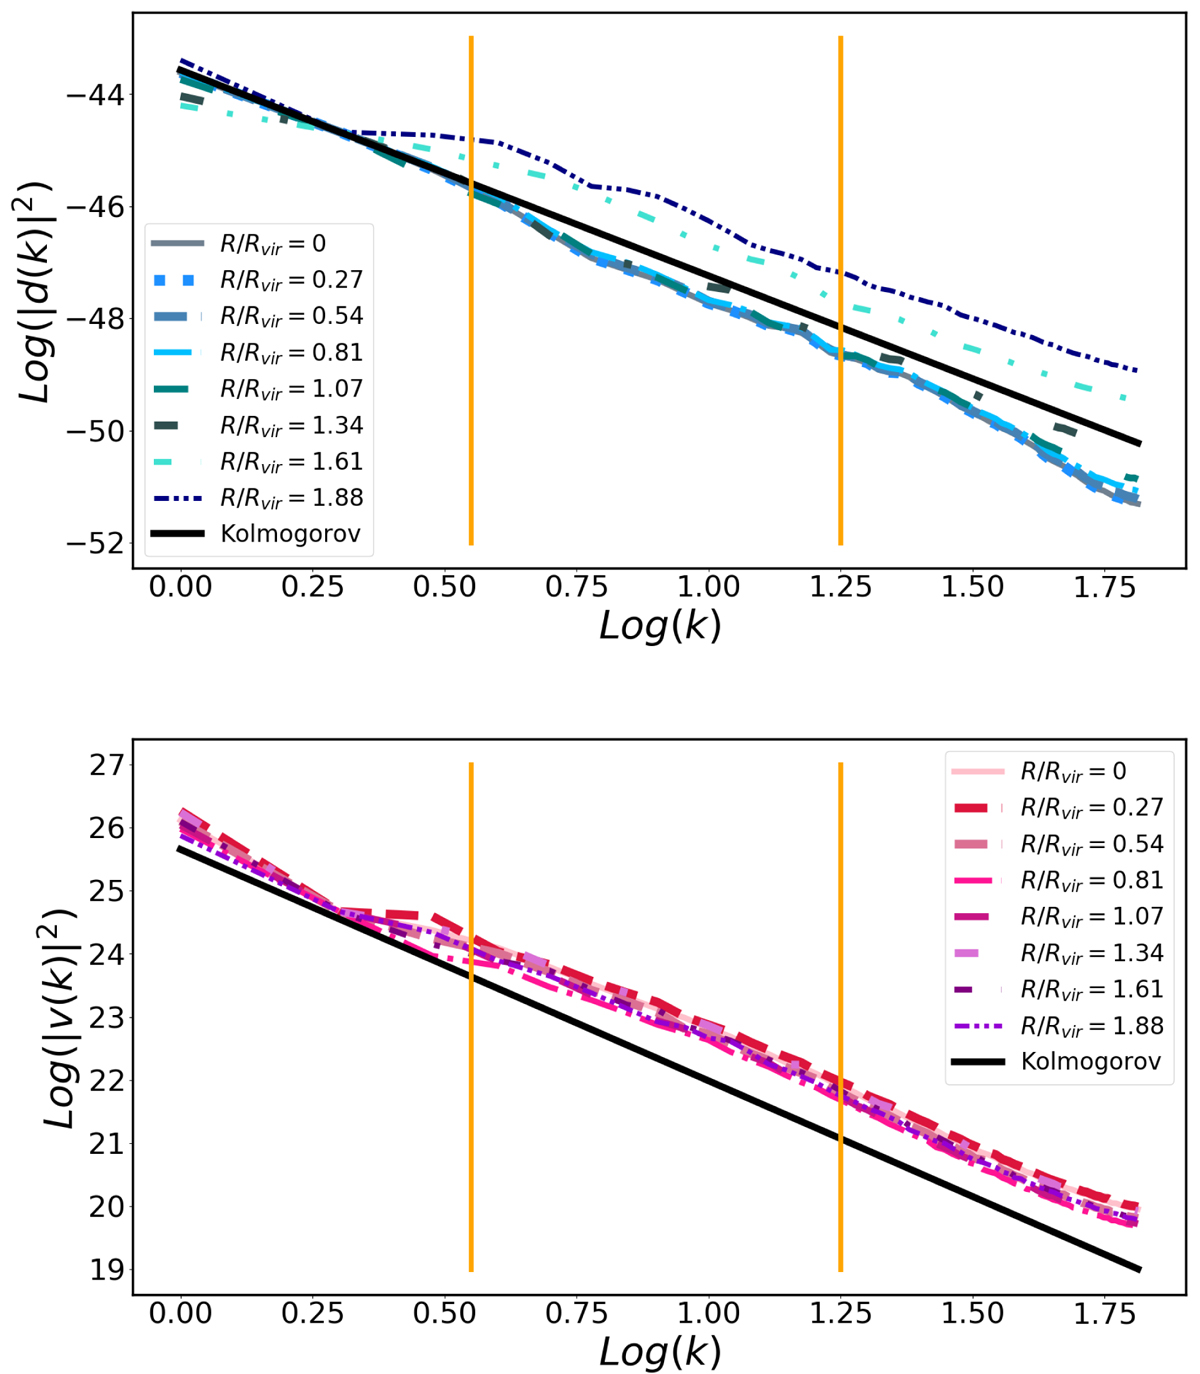
Density and velocity power spectra in a simulated cluster from the Itasca sample, obtained at different radii. The vertical orange bars indicate the selected inertial subrange used for the analysis. The normalisation of density spectra has a radial trend, with larger fluctuations in the outer regions.
Current usage metrics show cumulative count of Article Views (full-text article views including HTML views, PDF and ePub downloads, according to the available data) and Abstracts Views on Vision4Press platform.
Data correspond to usage on the plateform after 2015. The current usage metrics is available 48-96 hours after online publication and is updated daily on week days.
Initial download of the metrics may take a while.