Fig. 3.
Download original image
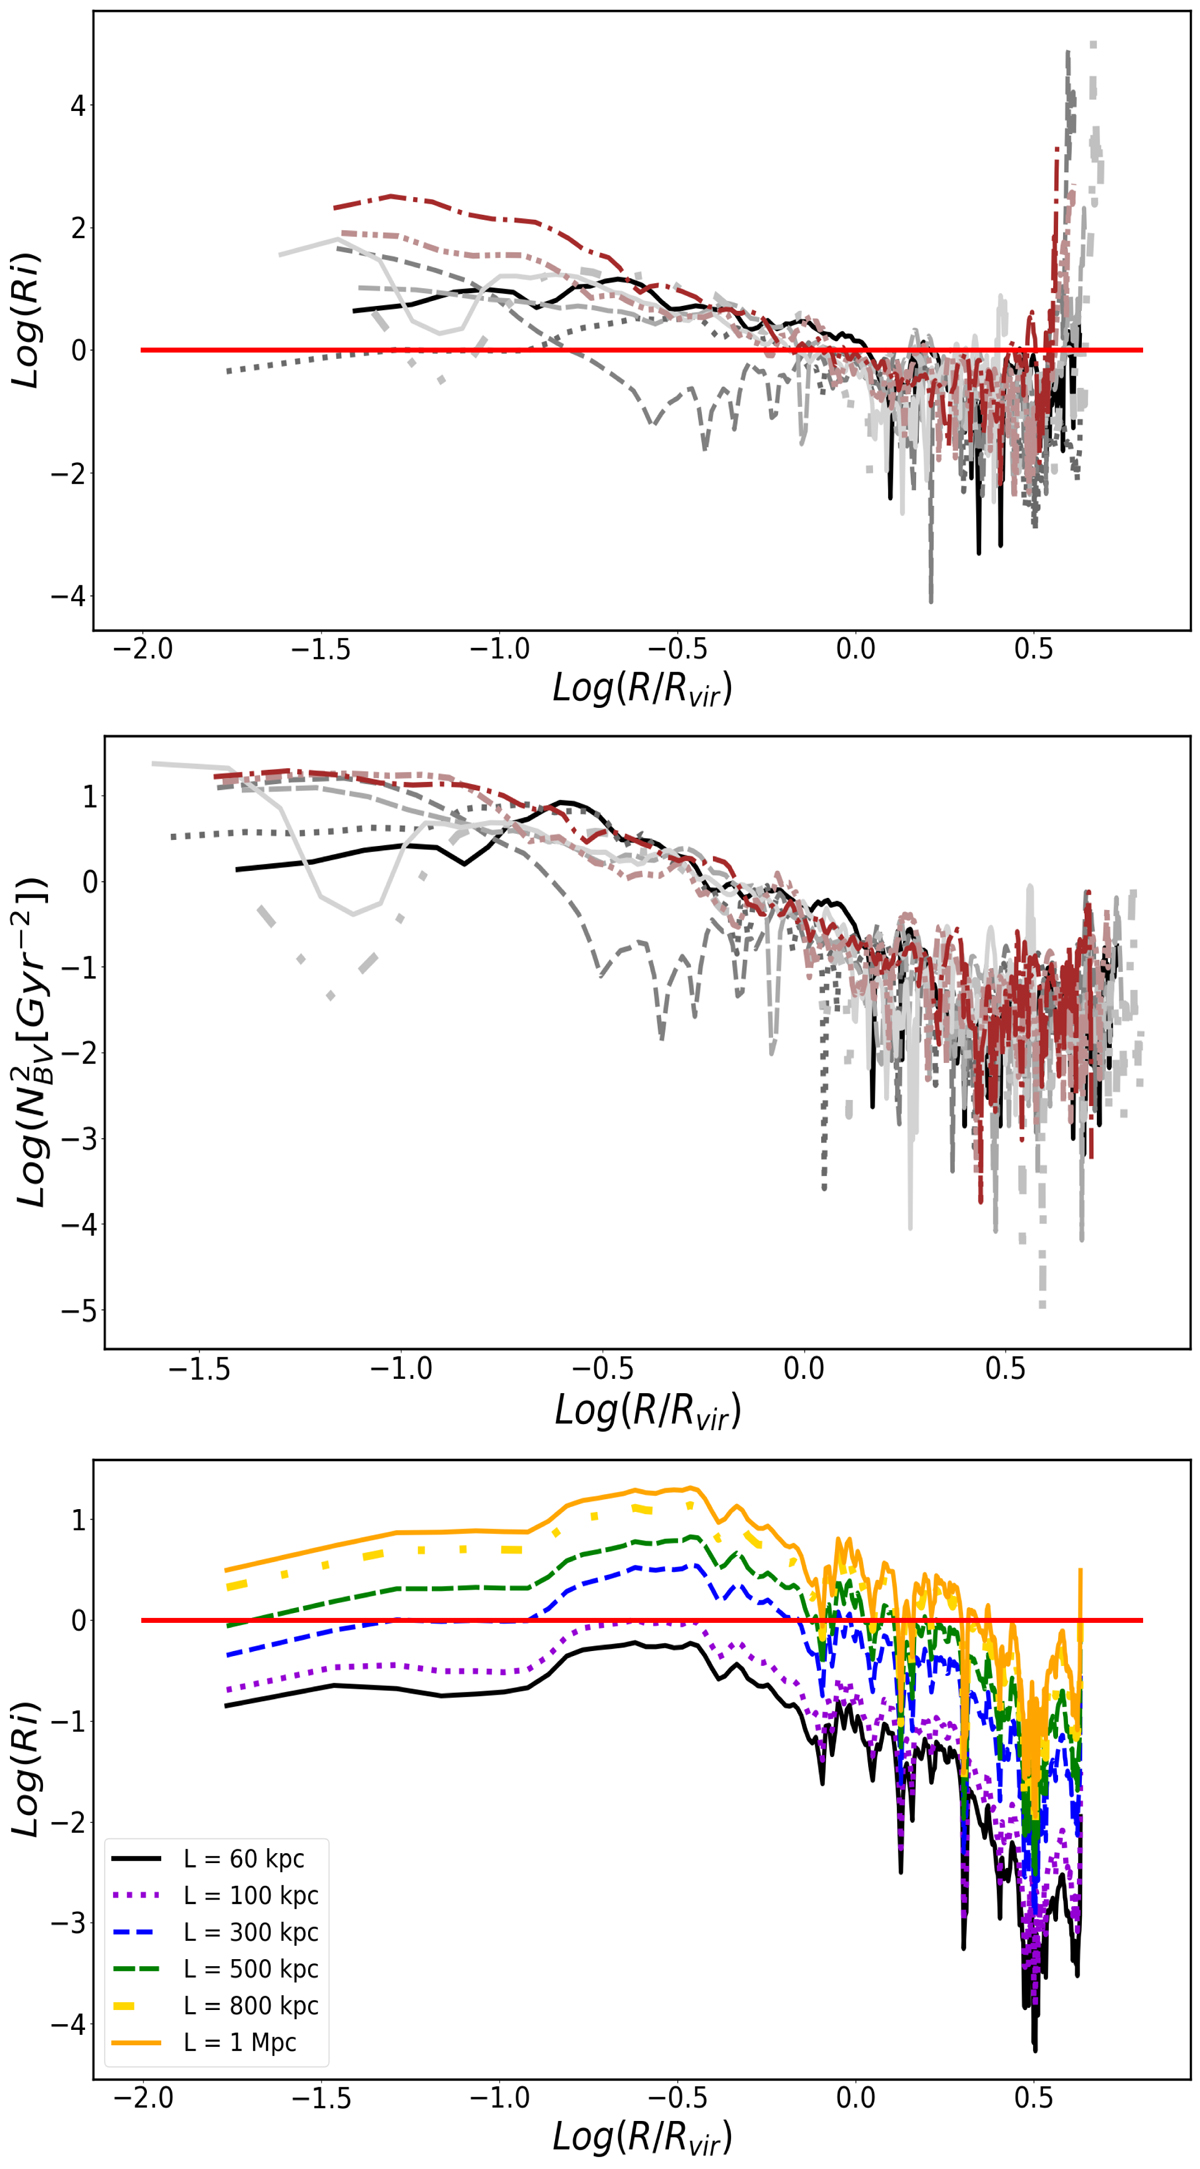
Top panel: radial profile of the Richardson number in our clusters. Middle panel: radial profile of the Brunt-Väisala frequency for each cluster of the sample. Lower panel: radial profile of the Richardson number considering different filtering scales L, for a single cluster of our sample. The horizontal red line separates the turbulence-dominated (Ri < 1) and buoyancy-dominated (Ri > 1) regimes.
Current usage metrics show cumulative count of Article Views (full-text article views including HTML views, PDF and ePub downloads, according to the available data) and Abstracts Views on Vision4Press platform.
Data correspond to usage on the plateform after 2015. The current usage metrics is available 48-96 hours after online publication and is updated daily on week days.
Initial download of the metrics may take a while.