Fig. 11.
Download original image
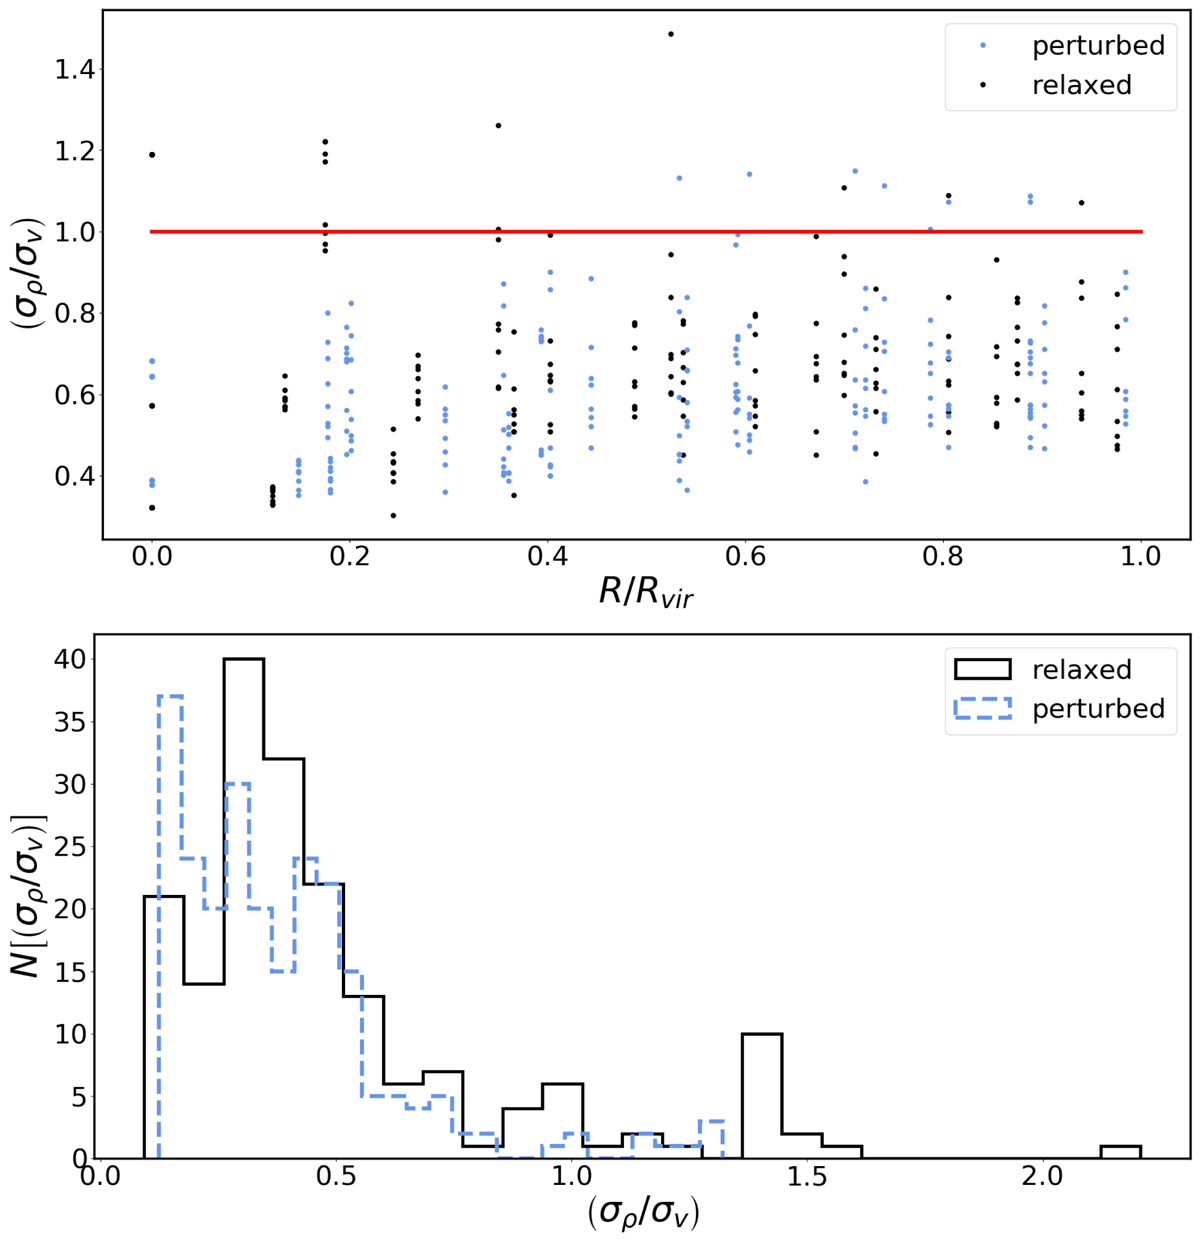
Top panel: ratio of the amplitudes of density and velocity fluctuations as function of the distance from the cluster centre. Bottom panel: distribution of the ratio between density and velocity rms. The black points (line) correspond to relaxed clusters and blue points (line) to the perturbed ones. The classification into relaxed and perturbed clusters is based on the centroid shift parameter, whose discriminating value is wc = 0.0067.
Current usage metrics show cumulative count of Article Views (full-text article views including HTML views, PDF and ePub downloads, according to the available data) and Abstracts Views on Vision4Press platform.
Data correspond to usage on the plateform after 2015. The current usage metrics is available 48-96 hours after online publication and is updated daily on week days.
Initial download of the metrics may take a while.