Free Access
Fig. 1.
Download original image
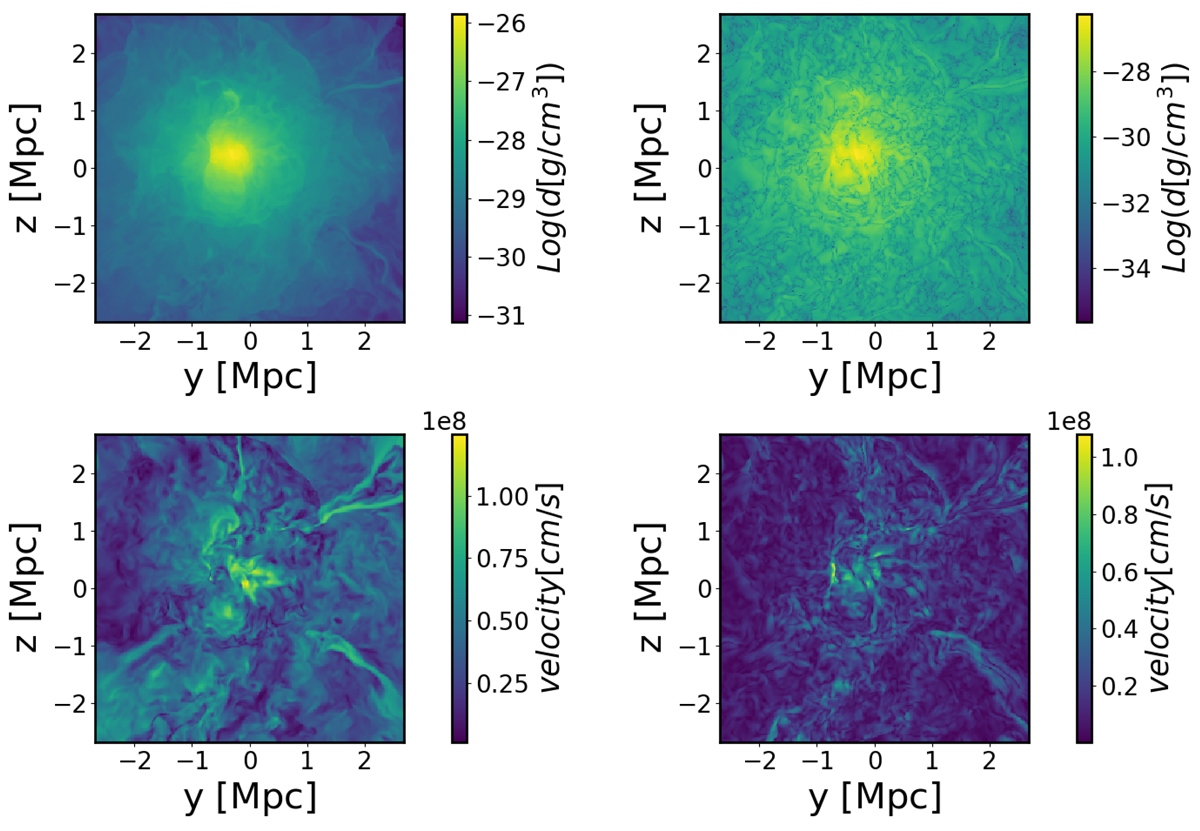
Slice of the original density and velocity 3D distributions in one cluster (left panels). Right panels: turbulent density and velocity fluctuations maps, after the application of the fixed-scale filtering method.
Current usage metrics show cumulative count of Article Views (full-text article views including HTML views, PDF and ePub downloads, according to the available data) and Abstracts Views on Vision4Press platform.
Data correspond to usage on the plateform after 2015. The current usage metrics is available 48-96 hours after online publication and is updated daily on week days.
Initial download of the metrics may take a while.