Fig. 6.
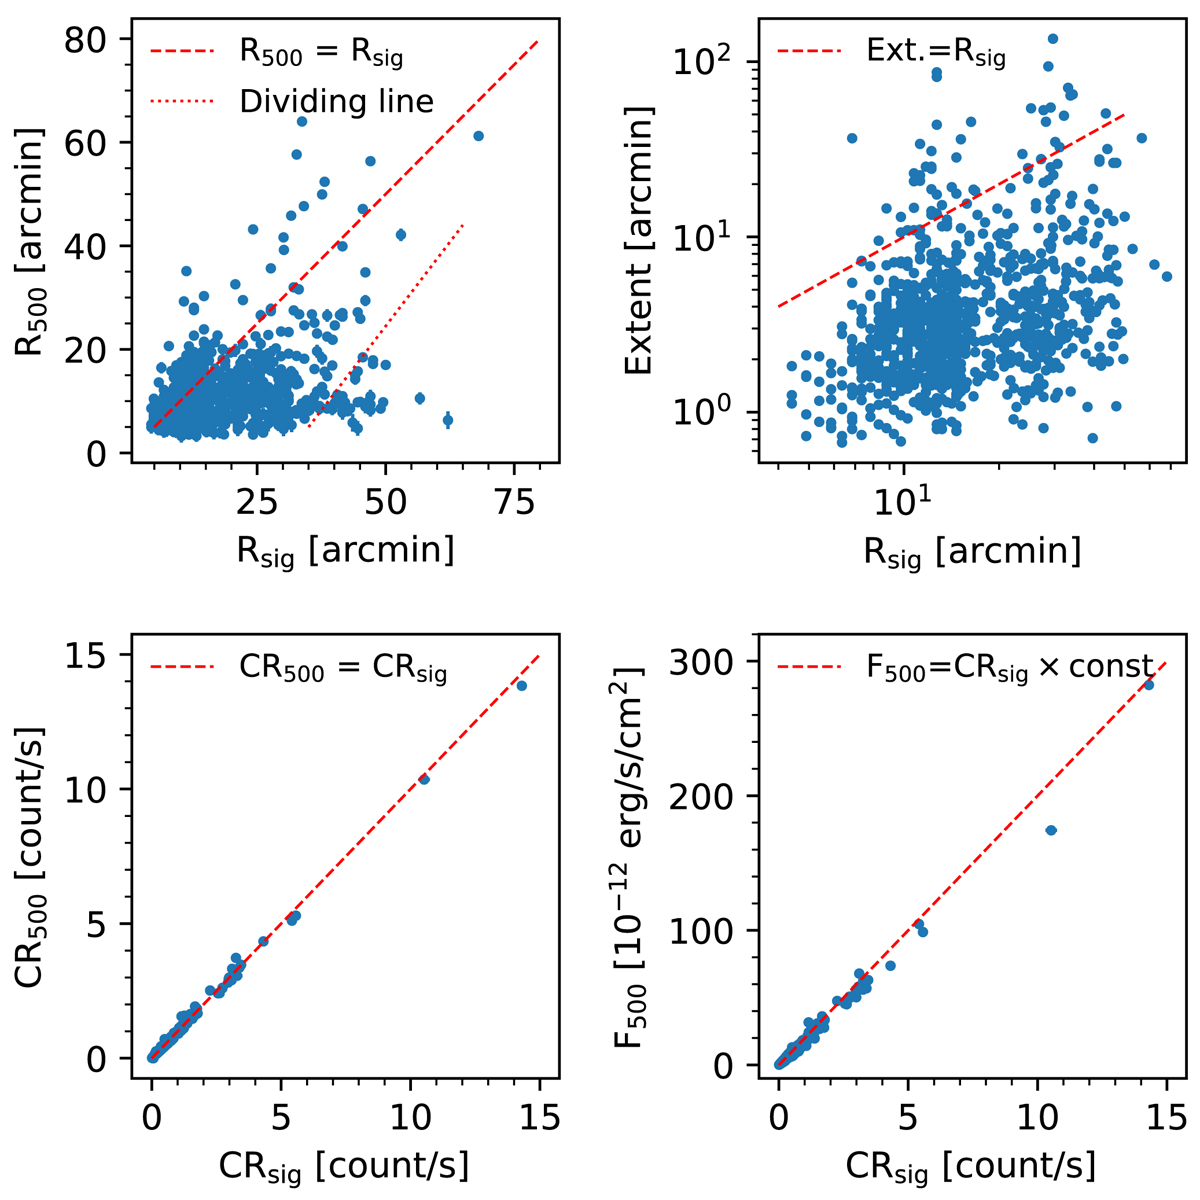
Download original image
Relation between the R500, Rsig, extent, the integrated count rate within R500, the integrated count rate within Rsig, and the flux inside R500. Top-left, top-right, and bottom-left panels: the red dashed line labels the 1:1 relation, while bottom-right panel: relation of F500 = CRsig × 2 × 10⁻¹¹ (erg s−1 cm−2)/(count s−1). Top-left panel: the red dotted line shows the dividing line to get the very extended candidates discussed in Sect. 4.1.
Current usage metrics show cumulative count of Article Views (full-text article views including HTML views, PDF and ePub downloads, according to the available data) and Abstracts Views on Vision4Press platform.
Data correspond to usage on the plateform after 2015. The current usage metrics is available 48-96 hours after online publication and is updated daily on week days.
Initial download of the metrics may take a while.