Fig. 5.
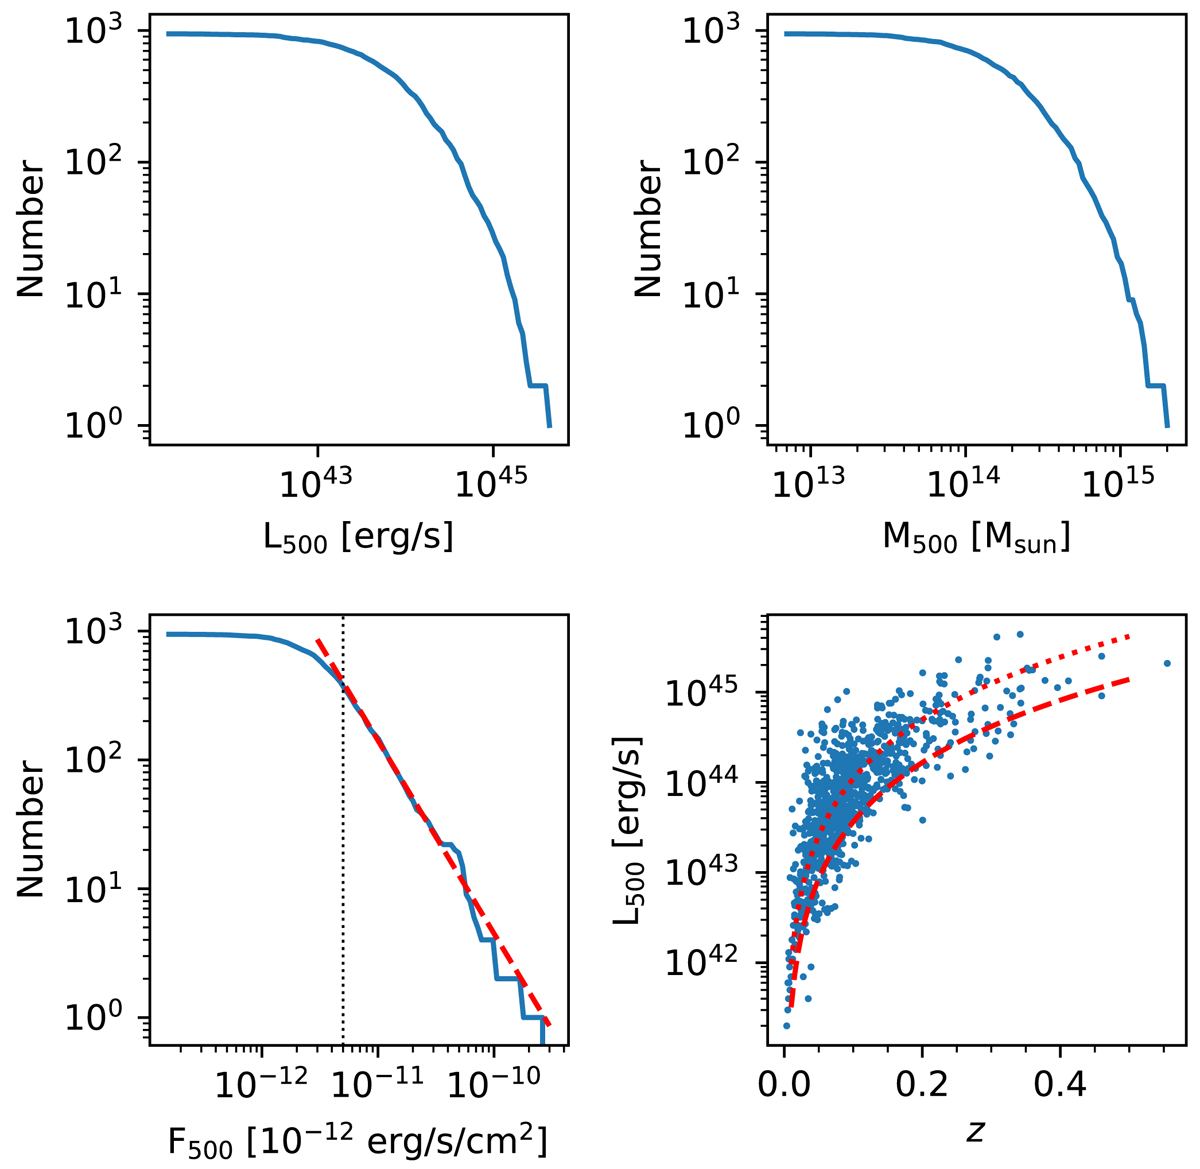
Download original image
Relation between the value of L500, M500, F500, and the integrated cluster numbers with larger luminosity, mass, or flux. Bottom-left panel: the dashed line has a slope of −1.5, normalized to match the value with fX = 2 × 10⁻¹¹ erg s−1 cm−2. The dotted vertical line labels the flux of 5 × 10⁻¹² erg s−1 cm−2. Bottom-right panel: relation between the redshift and L500. The curves for the flux limits of 10−12 and 3 × 10⁻¹² erg s−1 cm−2 are overlapped as dotted curve and dashed curve, respectively. Both the F500 and L500 are the value in [0.1−2.4] keV band.
Current usage metrics show cumulative count of Article Views (full-text article views including HTML views, PDF and ePub downloads, according to the available data) and Abstracts Views on Vision4Press platform.
Data correspond to usage on the plateform after 2015. The current usage metrics is available 48-96 hours after online publication and is updated daily on week days.
Initial download of the metrics may take a while.