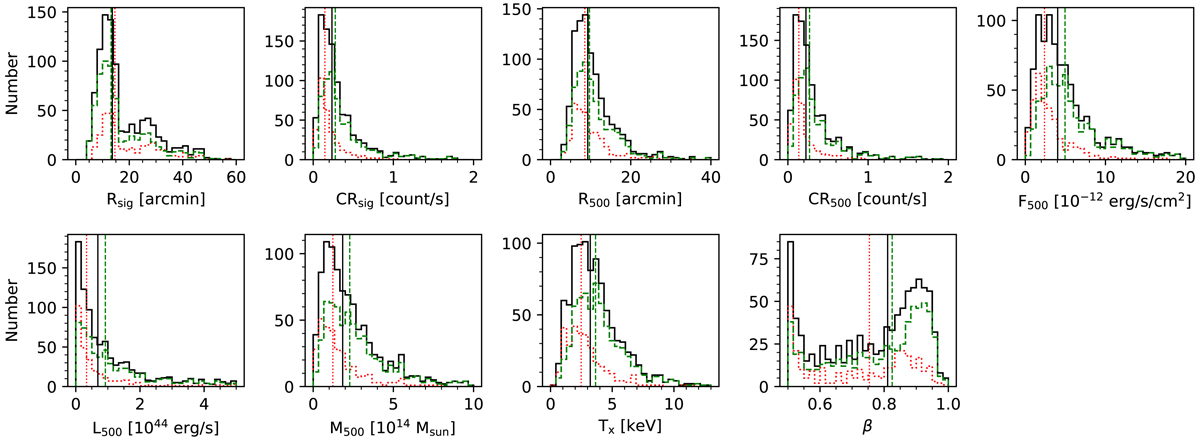
Fig. 4.
Download original image
Distribution of parameters of the RXGCC sample, the previous ICM-detected sample (Bronze), and the new ICM-detected sample (Gold+Silver), shown as solid, dashed, and dotted histograms and lines, in sequence. We refer to Sect. 2.4.1 for details on the estimation methods. Both the F500 and L500 are the values in [0.1−2.4] keV band. We manually set the upper parameter limit of the axis in the plot, to remove a few outliers with large parameter value in the histogram.
Current usage metrics show cumulative count of Article Views (full-text article views including HTML views, PDF and ePub downloads, according to the available data) and Abstracts Views on Vision4Press platform.
Data correspond to usage on the plateform after 2015. The current usage metrics is available 48-96 hours after online publication and is updated daily on week days.
Initial download of the metrics may take a while.