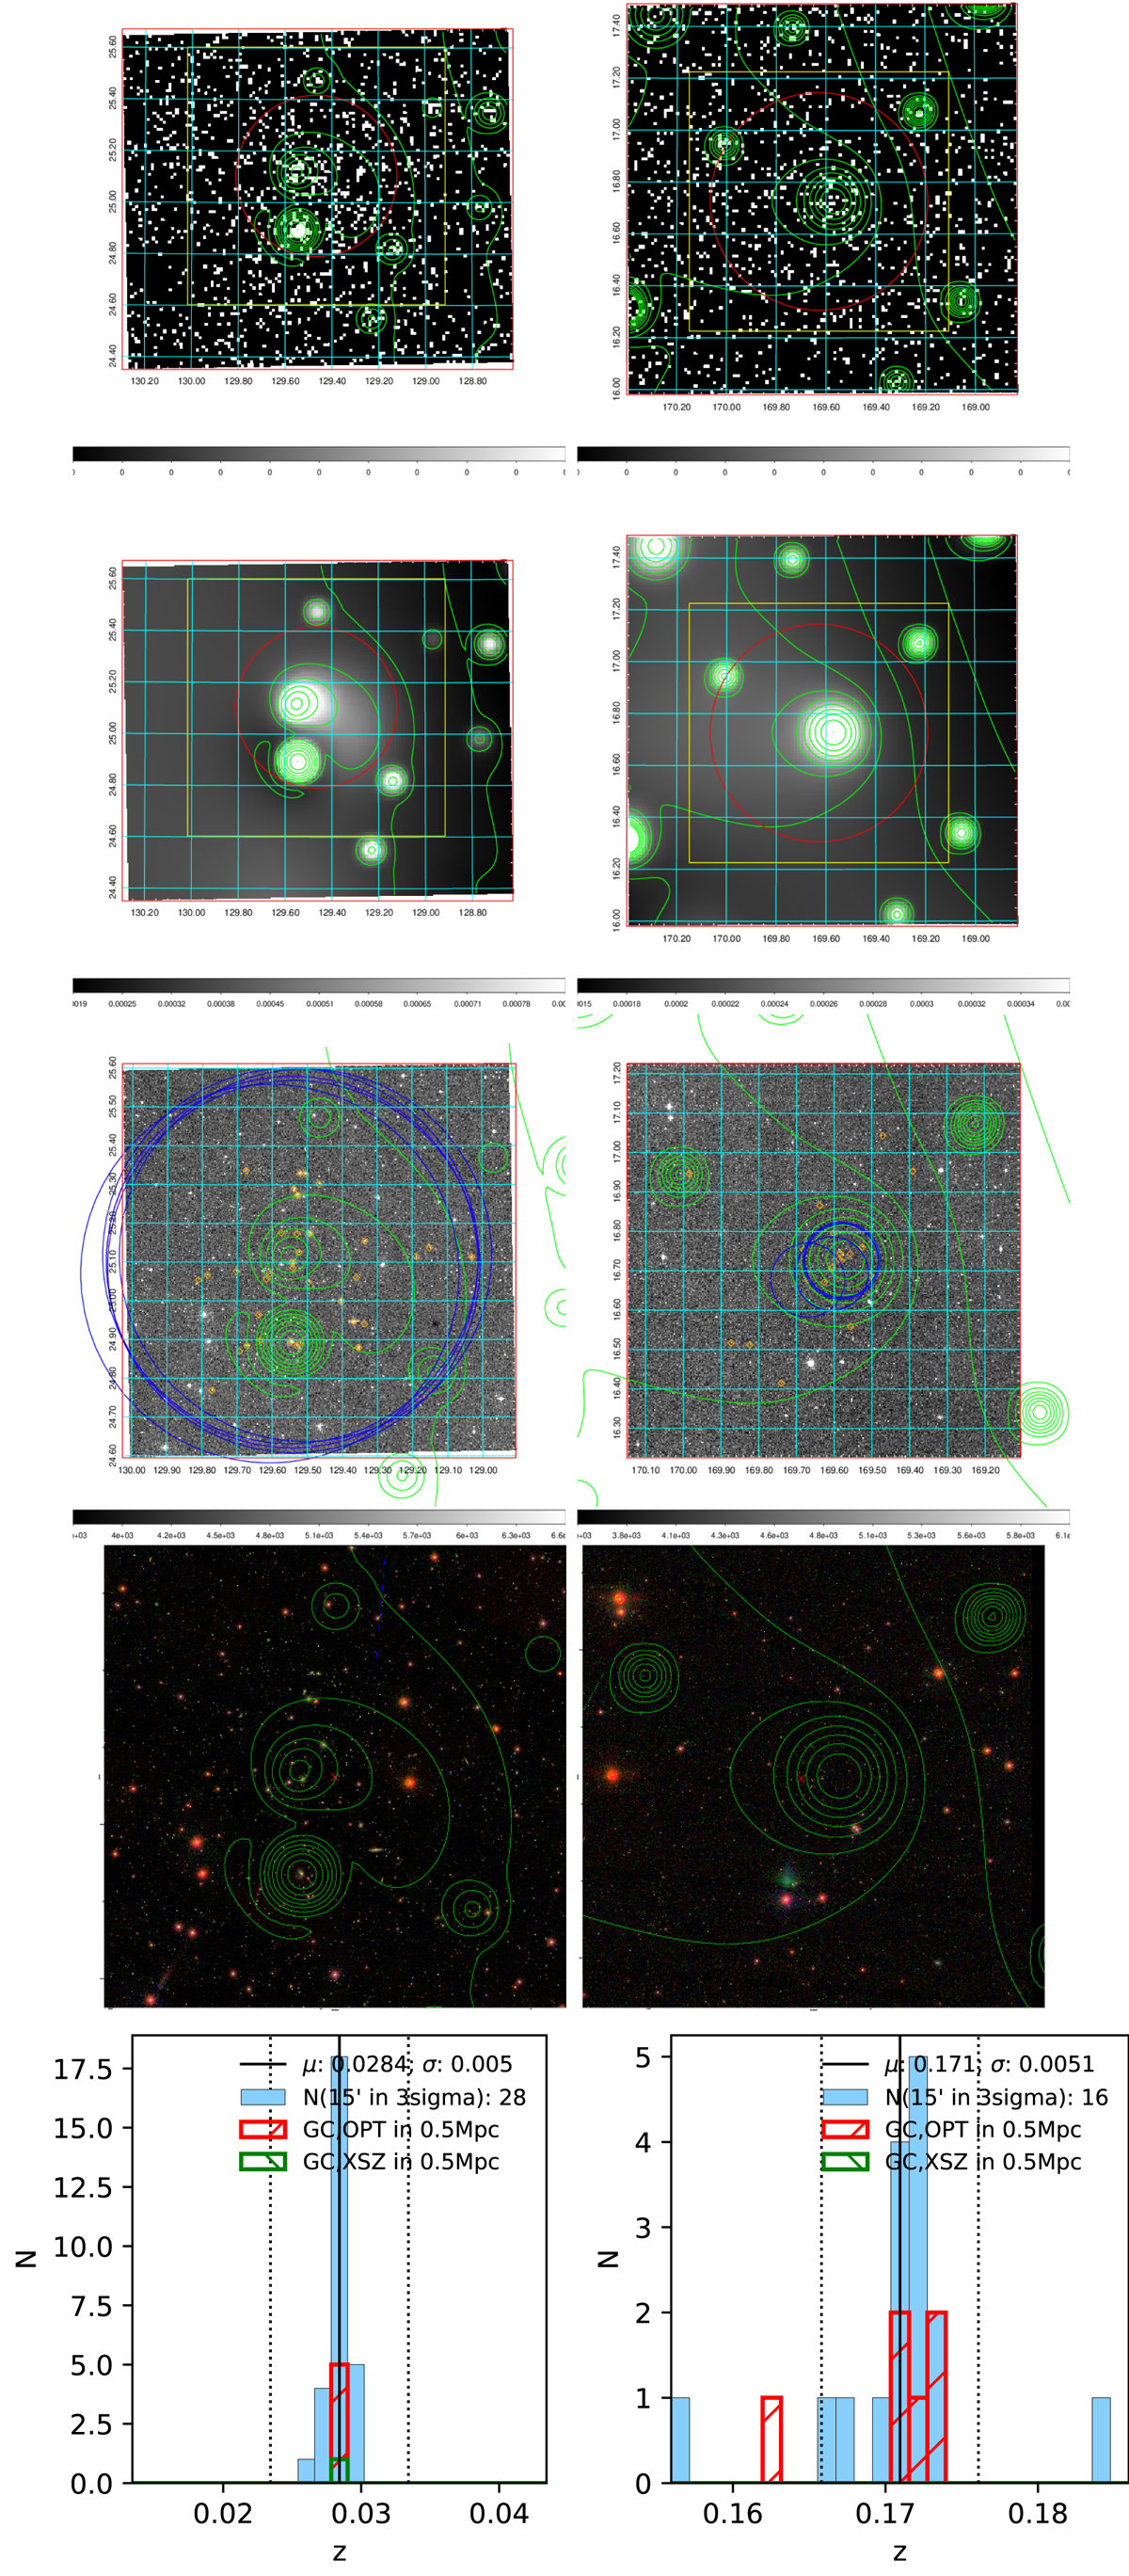
Fig. E.1.
Download original image
Two RXGCC clusters with extent > 15′. The left column lists images of RXGCC 296 and the right column for RXGCC 400. In every column, the panels show (from top to bottom), the RASS image in [0.5−2.0] keV, reconstructed image with wavelet filtering, DSS image, SDSS image, and the redshift histogram. In the first two rows, the center and radius of red circles indicate the position and extent of the candidate, while green contours are obtained from the reconstructed image indicating the smoothed X-ray emission. The images in the third and fourth rows are with the size of 1° ×1°, which is labeled with the yellow box in the first two rows. The DSS images are overlaid with yellow diamonds and blue circles for galaxies and galaxy clusters with Δz < 0.01, respectively. The radius of blue circles is 1 Mpc. The red cross in the fourth panel labels the position of our candidate. The redshift distribution of galaxies with the offset < 15′ and < 0.5 Mpc is shown in the last row, which is overlaid with the redshift of previous optical and ICM-detected clusters respectively in red and green histograms. The redshift of the candidate is shown in solid black line, while the upper and lower limits of 1σ are shown with black dotted lines.
Current usage metrics show cumulative count of Article Views (full-text article views including HTML views, PDF and ePub downloads, according to the available data) and Abstracts Views on Vision4Press platform.
Data correspond to usage on the plateform after 2015. The current usage metrics is available 48-96 hours after online publication and is updated daily on week days.
Initial download of the metrics may take a while.