Free Access
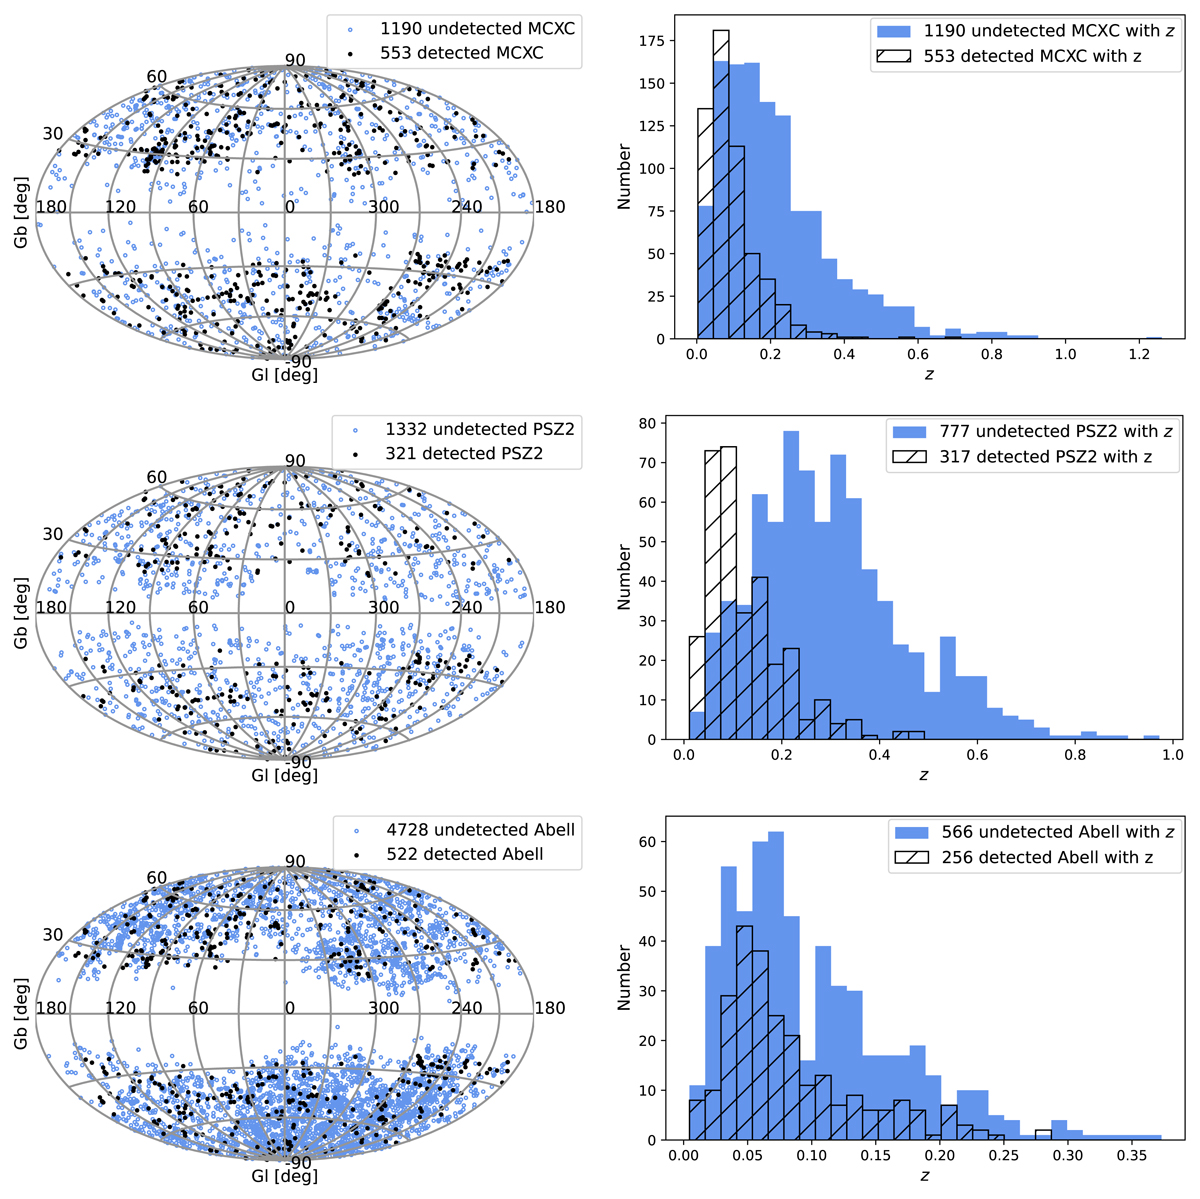
Fig. C.1.
Download original image
Comparison of spatial distribution (left panels) and redshift distribution (right panels) of detected and undetected MCXC, PSZ2 and Abell clusters, from the top to the bottom panels.
Current usage metrics show cumulative count of Article Views (full-text article views including HTML views, PDF and ePub downloads, according to the available data) and Abstracts Views on Vision4Press platform.
Data correspond to usage on the plateform after 2015. The current usage metrics is available 48-96 hours after online publication and is updated daily on week days.
Initial download of the metrics may take a while.