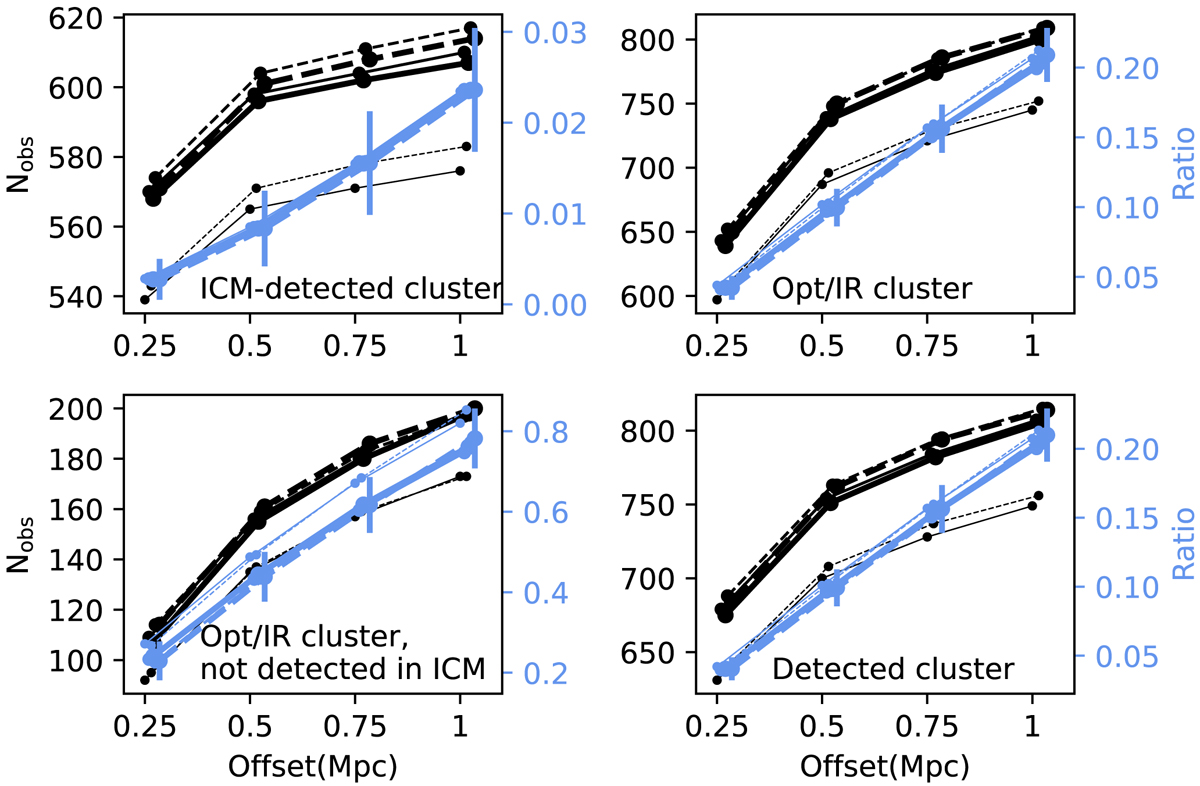
Fig. B.1.
Download original image
Number of detections (shown as black line with labels on the left) and contamination ratio (shown as blue line with labels on the right) varies with the offset threshold in the cross-matching with previously identified clusters (shown in X-axis). The offset has been set to be 0.25, 0.5, 0.75, 1.0 Mpc. The dots in the plot are shifted to the right with a little distance to avoid the overlapping. The detection numbers and contamination ratio for previous ICM-detected clusters (top-left panel), previous optical/infrared clusters (top-right panel), previous optical/infrared clusters not detected in ICM (bottom-left panel), the whole sample of detections (bottom-right panel) are shown. The solid and dashed lines show the results when the upper limit of galaxy redshift is set to be 0.3 and 0.4, respectively. To estimate the redshift of detections, we consider three different situations. Firstly, we only take spectroscopic galaxy redshift into account (shown with thin lines). Secondly, we consider the spectroscopic galaxy redshift and photometric one separately (shown with lines in the normal width). Lastly, we combine the spectroscopic galaxy redshifts and photometric ones together without distinguishing them (shown with thick lines).
Current usage metrics show cumulative count of Article Views (full-text article views including HTML views, PDF and ePub downloads, according to the available data) and Abstracts Views on Vision4Press platform.
Data correspond to usage on the plateform after 2015. The current usage metrics is available 48-96 hours after online publication and is updated daily on week days.
Initial download of the metrics may take a while.