Fig. 10.
Download original image
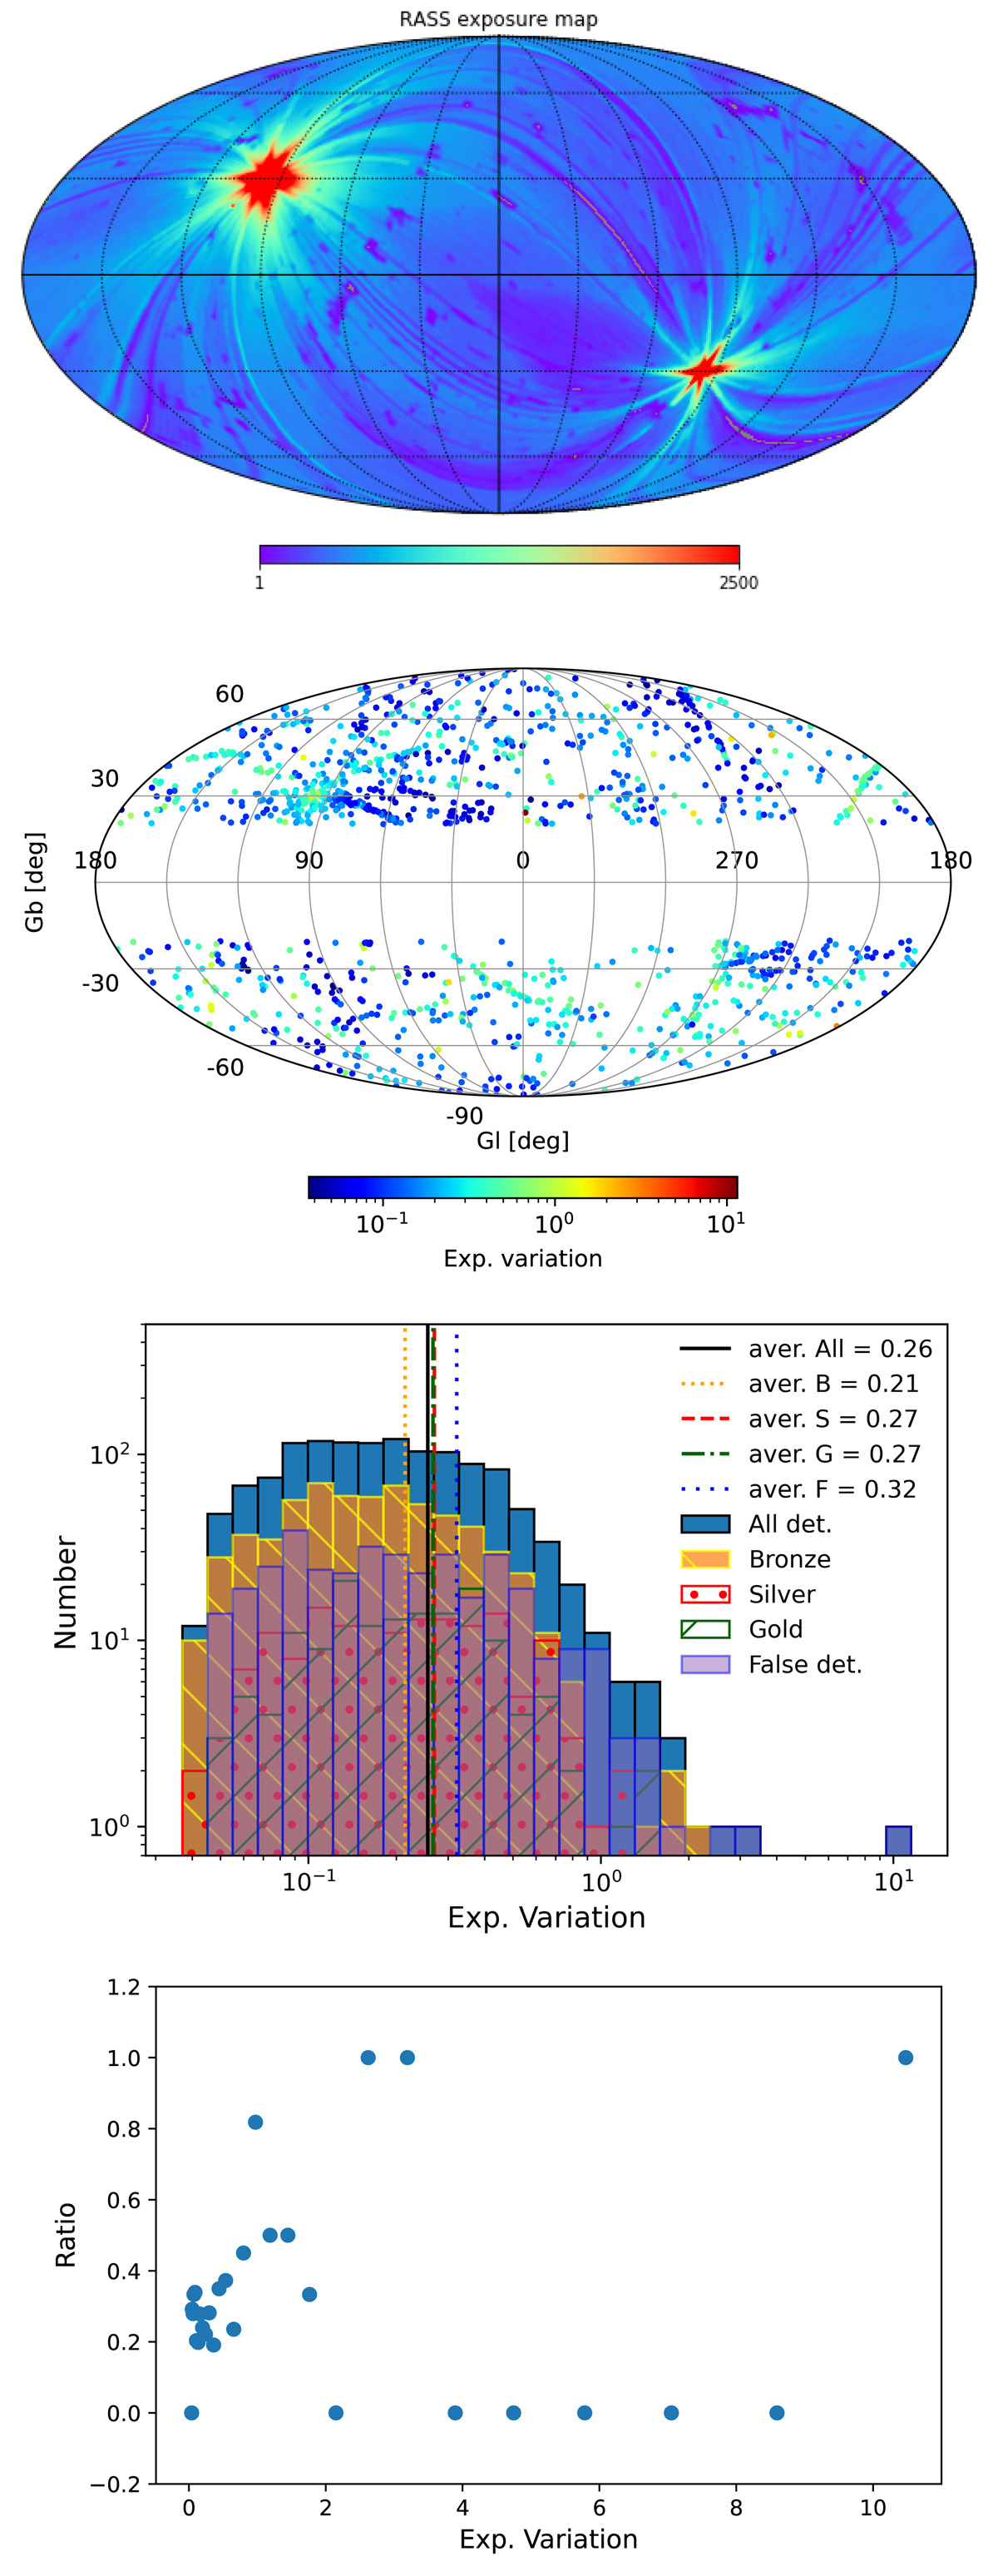
Exposure variation of detections. Top panel: RASS-II exposure map (adapted from the Fig. 1 of Voges et al. 1999). Second panel: all-sky distribution of all detections, colors vary with the exposure variation. Third panel: exposure variation distribution for detections in classes, the average value are overlaid with vertical lines. Bottom panel: relation between the false detection ratio with exposure variation.
Current usage metrics show cumulative count of Article Views (full-text article views including HTML views, PDF and ePub downloads, according to the available data) and Abstracts Views on Vision4Press platform.
Data correspond to usage on the plateform after 2015. The current usage metrics is available 48-96 hours after online publication and is updated daily on week days.
Initial download of the metrics may take a while.