Fig. 2.
Download original image
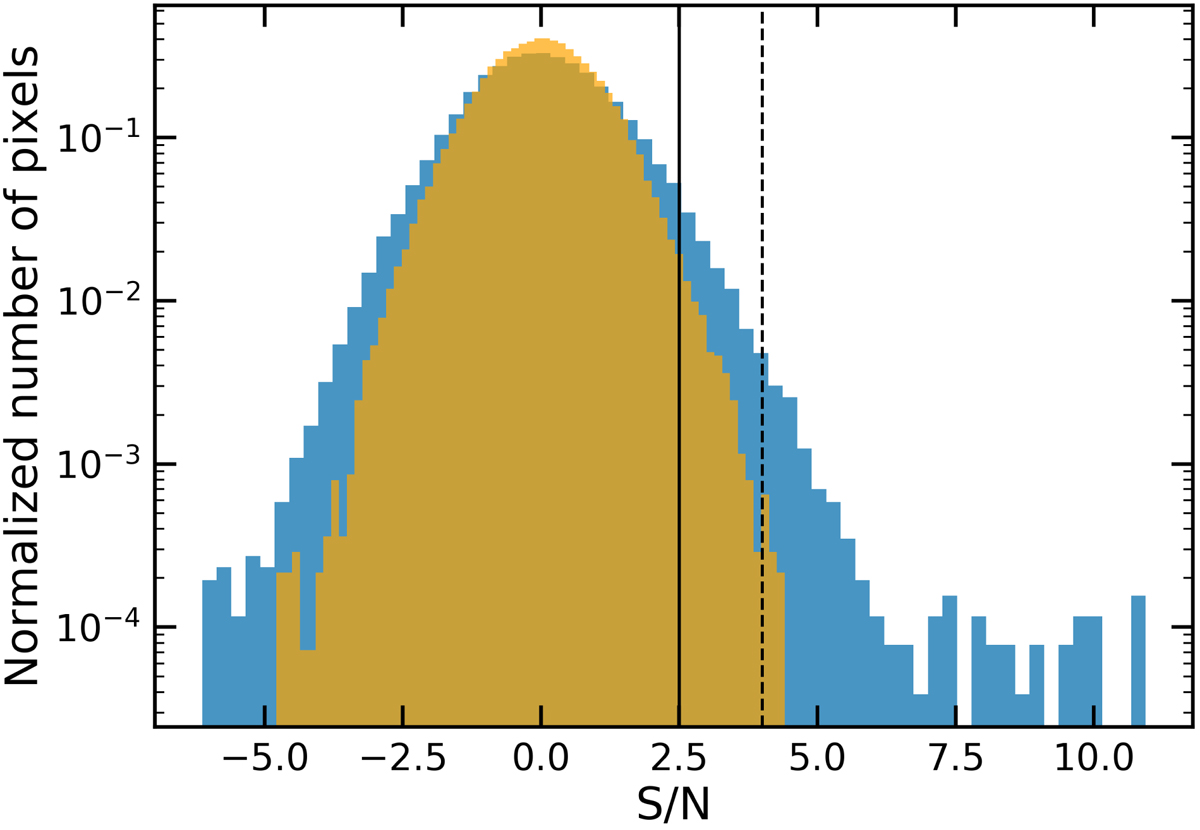
Histogram of signal-to-noise ratio for pixels located within the effective area of the Jackpot map (blue) and the corresponding jackknife map (yellow). The solid vertical line represents the 2.5σ cut used in our simulations. The dashed line represents the threshold of 4σ above which we catalog sources. We note that the excessive negative signals compared to the jackknife map are a result of matched filtering, which can be properly accounted for during source extraction processes using a correct PSF.
Current usage metrics show cumulative count of Article Views (full-text article views including HTML views, PDF and ePub downloads, according to the available data) and Abstracts Views on Vision4Press platform.
Data correspond to usage on the plateform after 2015. The current usage metrics is available 48-96 hours after online publication and is updated daily on week days.
Initial download of the metrics may take a while.