Open Access
Fig. 4
Download original image
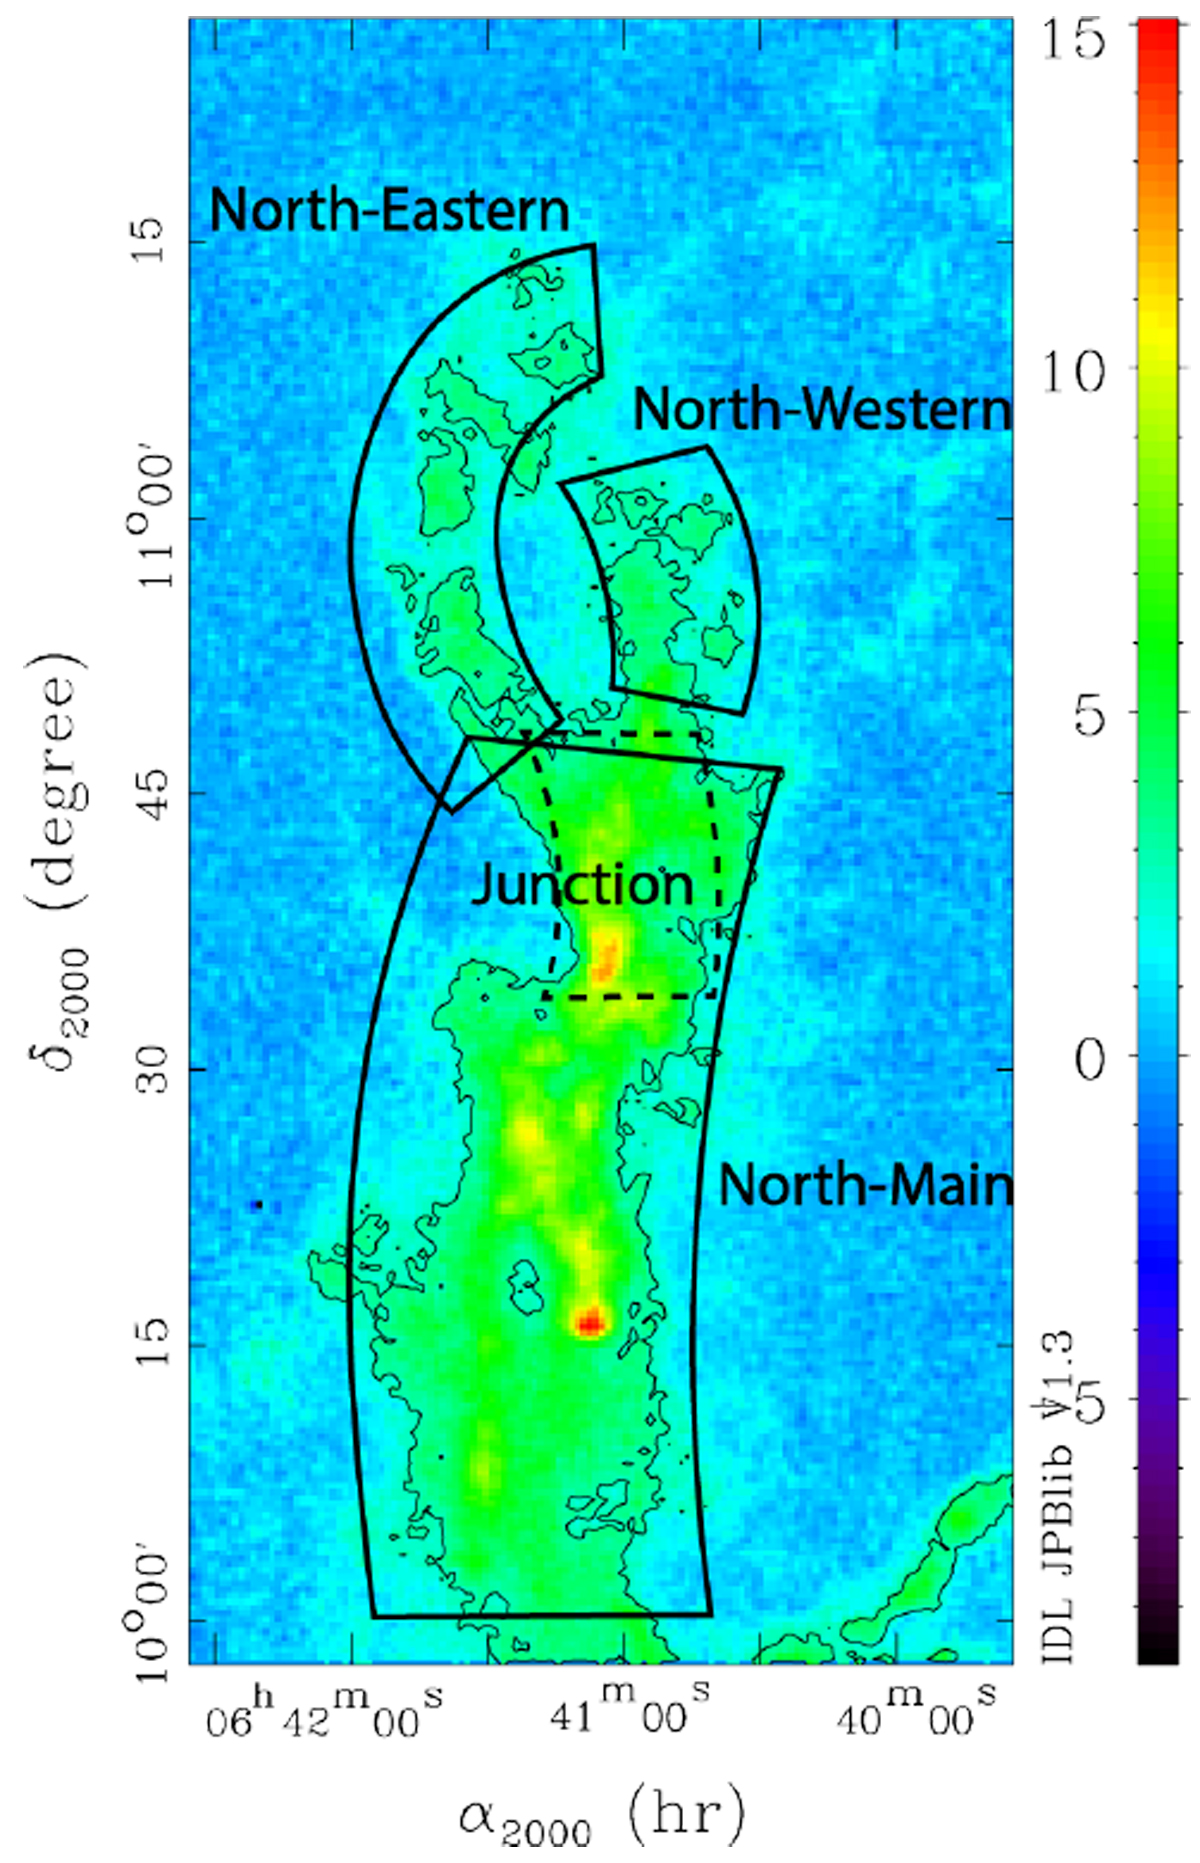
TRAO 13CO integrated (between vlsr = −3 and 17 km s−1)
![]() emission map of the northern part of the cloud in K km s−1
with the schematic representation of the sub-structures. Contours are taken at 5 K km s−1.
emission map of the northern part of the cloud in K km s−1
with the schematic representation of the sub-structures. Contours are taken at 5 K km s−1.
Current usage metrics show cumulative count of Article Views (full-text article views including HTML views, PDF and ePub downloads, according to the available data) and Abstracts Views on Vision4Press platform.
Data correspond to usage on the plateform after 2015. The current usage metrics is available 48-96 hours after online publication and is updated daily on week days.
Initial download of the metrics may take a while.